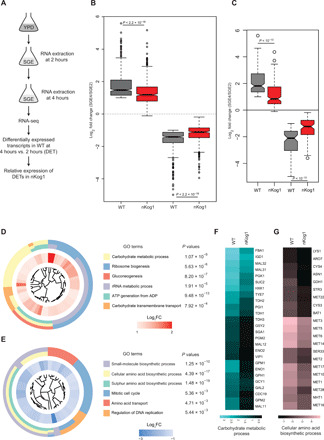
Fig. 3. Kog1 temporally regulates amino acid biosynthetic and gluconeogenic gene expression.

(A) Schematic showing the experimental design for comparative transcriptome analysis by RNA-seq. (B) Box plot showing global trends for up-regulated and down-regulated genes in WT and nKog1. Genes with ≥twofold change in mRNA expression (log2 fold change ≥ 1 and P value ≤ 10−4) after 4 hours in SGE, compared to 2-hour shift in WT cells, were classified as the differentially expressed transcripts (DETs). The corresponding fold changes of these DETs in nKog1 cells are shown, from identical experimental conditions. Also see fig. S3A. (C) Delayed up- or down-regulation of genes in nKog1. Box plot for transcripts (DETs) showing a differential expression in nKog1 cells with at least 1.5-fold difference (log2 fold change ≥ 0.6 and P ≤ 10−4) in relative expression compared to WT cells. (D and E) Gene Ontology (GO) mapping by biological processes for differentially expressed genes in nKog1 cells, in the up-regulated and down-regulated gene clusters, respectively. Enriched GO process terms along with their respective P values are shown. Inner circle shows expression (log2 fold) change for corresponding genes in nKog1 cells after a 4-hour shift to SGE, relative to 2-hour shift. FC, fold change. (F and G) Heatmaps showing relative changes in gene expression of transcripts in the most enriched GO processes, carbohydrate metabolic process and cellular amino acid biosynthetic process in WT and nKog1 cells. Also see fig. S3 (B to E).
