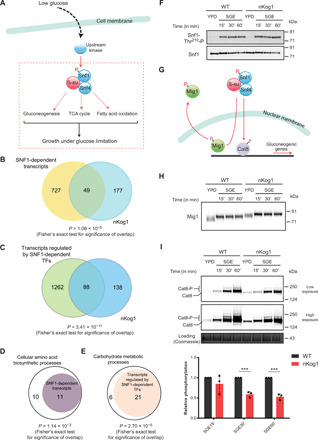
Fig. 4. Kog1 controls SNF1/AMPK dependent outputs in glucose and amino acid–limited conditions.

(A) Schematic illustrating the canonical outputs of SNF1/AMPK. In low glucose, Snf1 activation depends on T210 phosphorylation by upstream kinases. (B) Venn diagram depicting the overlap between SNF1-dependent transcripts (20) and differentially expressed genes in nKog1 cells. (C) Venn diagram depicting the overlap between transcripts regulated by SNF1-dependent transcription factors—Mig1, Cat8, Sip4, Rds2, and Adr1 (41)—and differentially expressed genes in nKog1 cells. Also see fig. S4A. (D and E) Plots showing a significant proportion of Kog1-dependent cellular amino acid biosynthetic processes and carbohydrate metabolic processes, genes that are known to be regulated by Snf1 and Snf1-dependent transcription factors, respectively. Also see fig. S4B. (F) Thr210 phosphorylation and levels of total Snf1 in WT and nKog1 cells in YPD and after shifting to SGE medium (time points indicated). A representative Western blot (n = 2) is shown. (G) Schematic showing downstream targets of SNF1 pathway, the Mig1 and Cat8 transcriptional regulators. (H) A representative Western blot (n = 3) for detection of Mig1 electrophoretic mobility, in WT and nKog1 cells in YPD and after shifting to SGE medium. (I) Representative Western blots and relative amounts of Cat8 phosphorylation in WT and nKog1 cells in YPD and after shifting to SGE medium. Data are represented as means ± SD (n = 3). ***P < 0.001 (unpaired Student’s t test). Also see fig. S4 (C to F).
