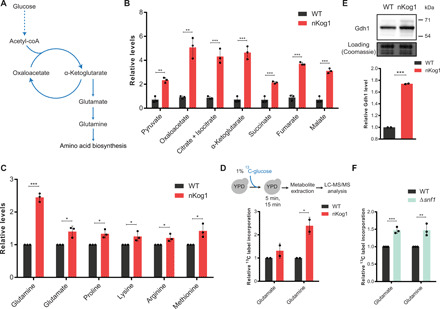
Fig. 5. Kog1 regulates Snf1-dependent outputs and carbon homeostasis irrespective of glucose and amino acid availability.

(A) Schematic showing amino acid biosynthesis from glucose via α-ketoglutarate. (B) Relative steady-state amounts of TCA cycle intermediates measured by LC-MS/MS (liquid chromatography–tandem mass spectrometry) in WT and nKog1 cells grown in YPD. Data are represented as means ± SD (n = 3). (C) Relative steady-state amounts of specific amino acids measured using LC-MS/MS in WT and nKog1 cells grown in YPD. Data are represented as means ± SD (n = 3). (D) Relative 13C label incorporation into glutamate and glutamine, measured in WT and nKog1 cells after a 15-min pulse of 1% 13C-glucose in YPD. Data are represented as means ± SD (n = 2). Also see fig. S5A. (E) A representative Western blot and relative amounts of Gdh1 protein in YPD in WT and nKog1 cells. Gdh1 was epitope tagged with HA and detected using anti-HA antibody. Data are represented as means ± SD (n = 2). (F) Relative 13C label incorporation into glutamate and glutamine measured in WT and Δsnf1 cells after a 15-min pulse of 1% 13C-glucose in YPD. Data are represented as means ± SD (n = 3). Also see fig. S5B. For all panels, *P < 0.05, **P < 0.01, and ***P < 0.001 (unpaired Student’s t test).
