
Fig. 3. Crack propagation behaviors of the representative strongly and weakly phase-separated gels under fatigue test.
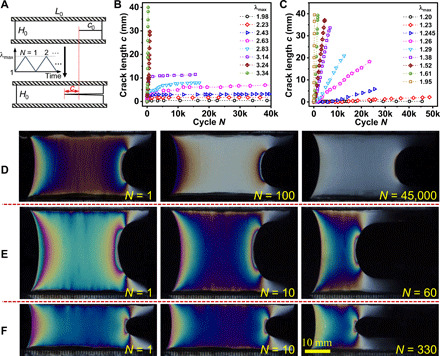
(A) Pure shear geometry (L0 = 50 mm, H0 = 10 mm, and c0 = 10 mm) and loading profile for fatigue test. During cyclic loading, the length of crack propagation was recorded as c. (B and C) Crack propagation behavior at different λmax for the strongly phase-separated gel PA-2.5-0.075 (B) and the weakly phase-separated gel PA-2.5-0.5 (C). (D and E) Typical evolutions of sample birefringence images with cycle number N for the representative strongly phase-separated gels at λmax < λtran (D) and λmax > λtran (E). Sample PA-2.5-0.075 at λmax = 2.64 and at λmax = 3.44 are taken as examples in (D) and (E), respectively. (F) Typical evolutions of sample birefringence images with cycle number N for the representative weakly phase-separated gel at a small λmax. Sample PA-2.5-0.5 at λmax = 1.81 is taken as an example.