
Fig. 4. Fatigue behavior of PA gels with different mesoscale phase contrasts.
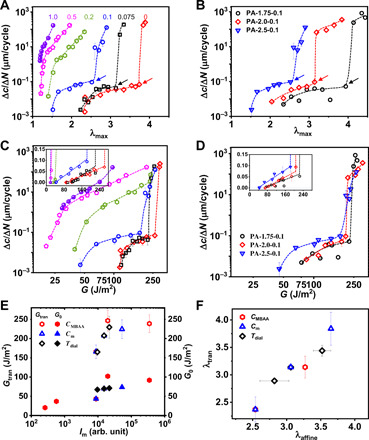
(A and B) Crack propagation rate Δc/ΔN in steady state as a function of λmax for sample series PA-2.5-CMBAA (A) and PA-Cm-0.1 (B). The numbers beside each curve in (A) represent CMBAA (mol %). The dashed lines are a guide for the eyes. The arrows in (A) and (B) indicate the transition points of slow-to-fast fatigue crack growth. (C and D) Crack propagation rate Δc/ΔN as a function of energy release rate G corresponding to (A) and (B), respectively. Inset shows the initial linear regime in the linear scale. Symbols in (C) are the same as those in (A). (E) Energy release rate at transition points of slow-to-fast fatigue crack growth (Gtran) (left y axis) and the threshold G0 (right y axis) extracted from (C) and (D) versus Im for the three series of samples. (F) Correlation between λtran for slow-to-fast mode transition in the fatigue test and the maximum stretch ratio λaffine for affine deformation of the phase structure in the tensile test for the three series of samples. The data of series PA-2.0-0.1(Tdial) are extracted from (25). The error bars are SEs from two to four measurements. Note that in these PA gels, G0 and λtran are characteristic material parameters, while Gtran is geometry dependent (see Fig. 5). The measurements were performed with samples of pure shear geometry (L0 = 50 mm, H0 = 10 mm, and c0 = 10 mm) and nominal strain rate 1 s−1.