
Fig. 6. Fatigue threshold determined by primary network structure.
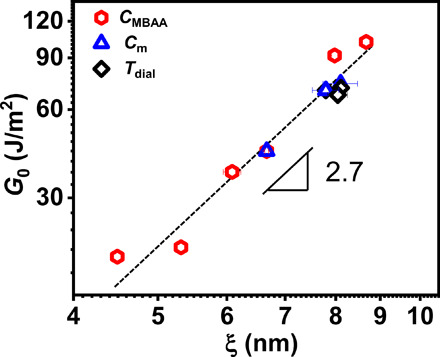
Logarithmic plot of fatigue threshold G0 as a function of mesh size ξ between permanent cross-linking points from both chemical cross-linking and trapped topological entanglements for three series of samples. The error bars are SEs from three measurements.