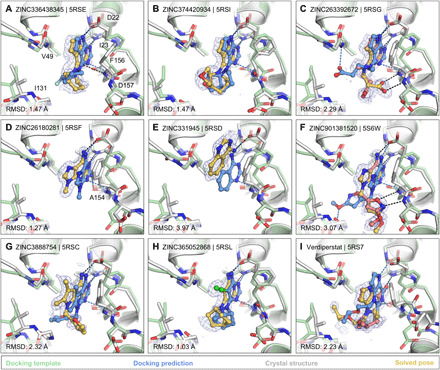
Fig. 3. Docking hits confirmed by high-resolution crystal structures.

The protein structure (PDB 6W02) (34) prepared for virtual screens is shown in green, predicted binding poses are shown in blue, the crystal protein structures are shown in gray, and the solved fragment poses are shown in yellow, with alternative conformations shown in light pink. PanDDA event maps are shown as a blue mesh. Event maps were calculated before ligand modeling, and the maps are free from model bias toward any ligand (39). Protein-ligand hydrogen bonds predicted by docking or observed in crystal structures are colored light blue or black, respectively. Hungarian RMSD values are presented between docked and crystallographically determined ligand poses (binding poses for additional docking hits are shown in fig. S7).
