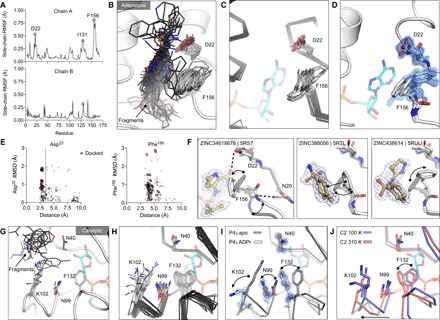
Fig. 7. Experimentally observed conformational heterogeneity is sampled by various fragments.

(A) Plots of side-chain RMSF for the 117 fragment structures from the UCSF screen using P43 crystals. (B) Stick representation showing all fragments (black sticks) within 3.5 Å of the Asp22 carboxylate and 4 Å of the Phe156 ring (white sticks). (C) Structural heterogeneity in the previously reported Mac1 structures. (D) The Phe156 side chain is captured in three conformations in the C2 apo structure. Electron density maps (2mFO-DFC) are contoured at 0.5 σ (blue surface) and 1 σ (blue mesh). For reference, ADPr is shown with blue sticks. (E) Plots of side-chain RMSD for Asp22 and Phe156 from the Mac1 apo structure as a function of ligand-protein distance. Structures were aligned by their Cα atoms, before RMSDs were calculated for the Asp22 carboxylate and the Phe156 aromatic carbons. (F) Fragment binding exploits preexisting conformational heterogeneity in the Phe156 side chain. The apo structure is shown with dark transparent gray sticks in each panel, and the conformational changes are annotated with arrows. (G) Stick representation showing all fragments (black sticks) in the outer subsite of the catalytic site. (H) Conformational heterogeneity of residues in the catalytic site of the previously reported Mac1 crystal structures. (I) ADPr binding induces a coupled conformational change in the Phe132, Asn99, and Lys102 side chains, as well as a 2-Å shift in the Phe132 loop. Electron density maps (2mFO-DFC) are contoured at 1.5 σ (blue surface) and 4 σ (blue mesh). (J) Mac1 structures determined at 100 and 310 K using C2 crystals.
