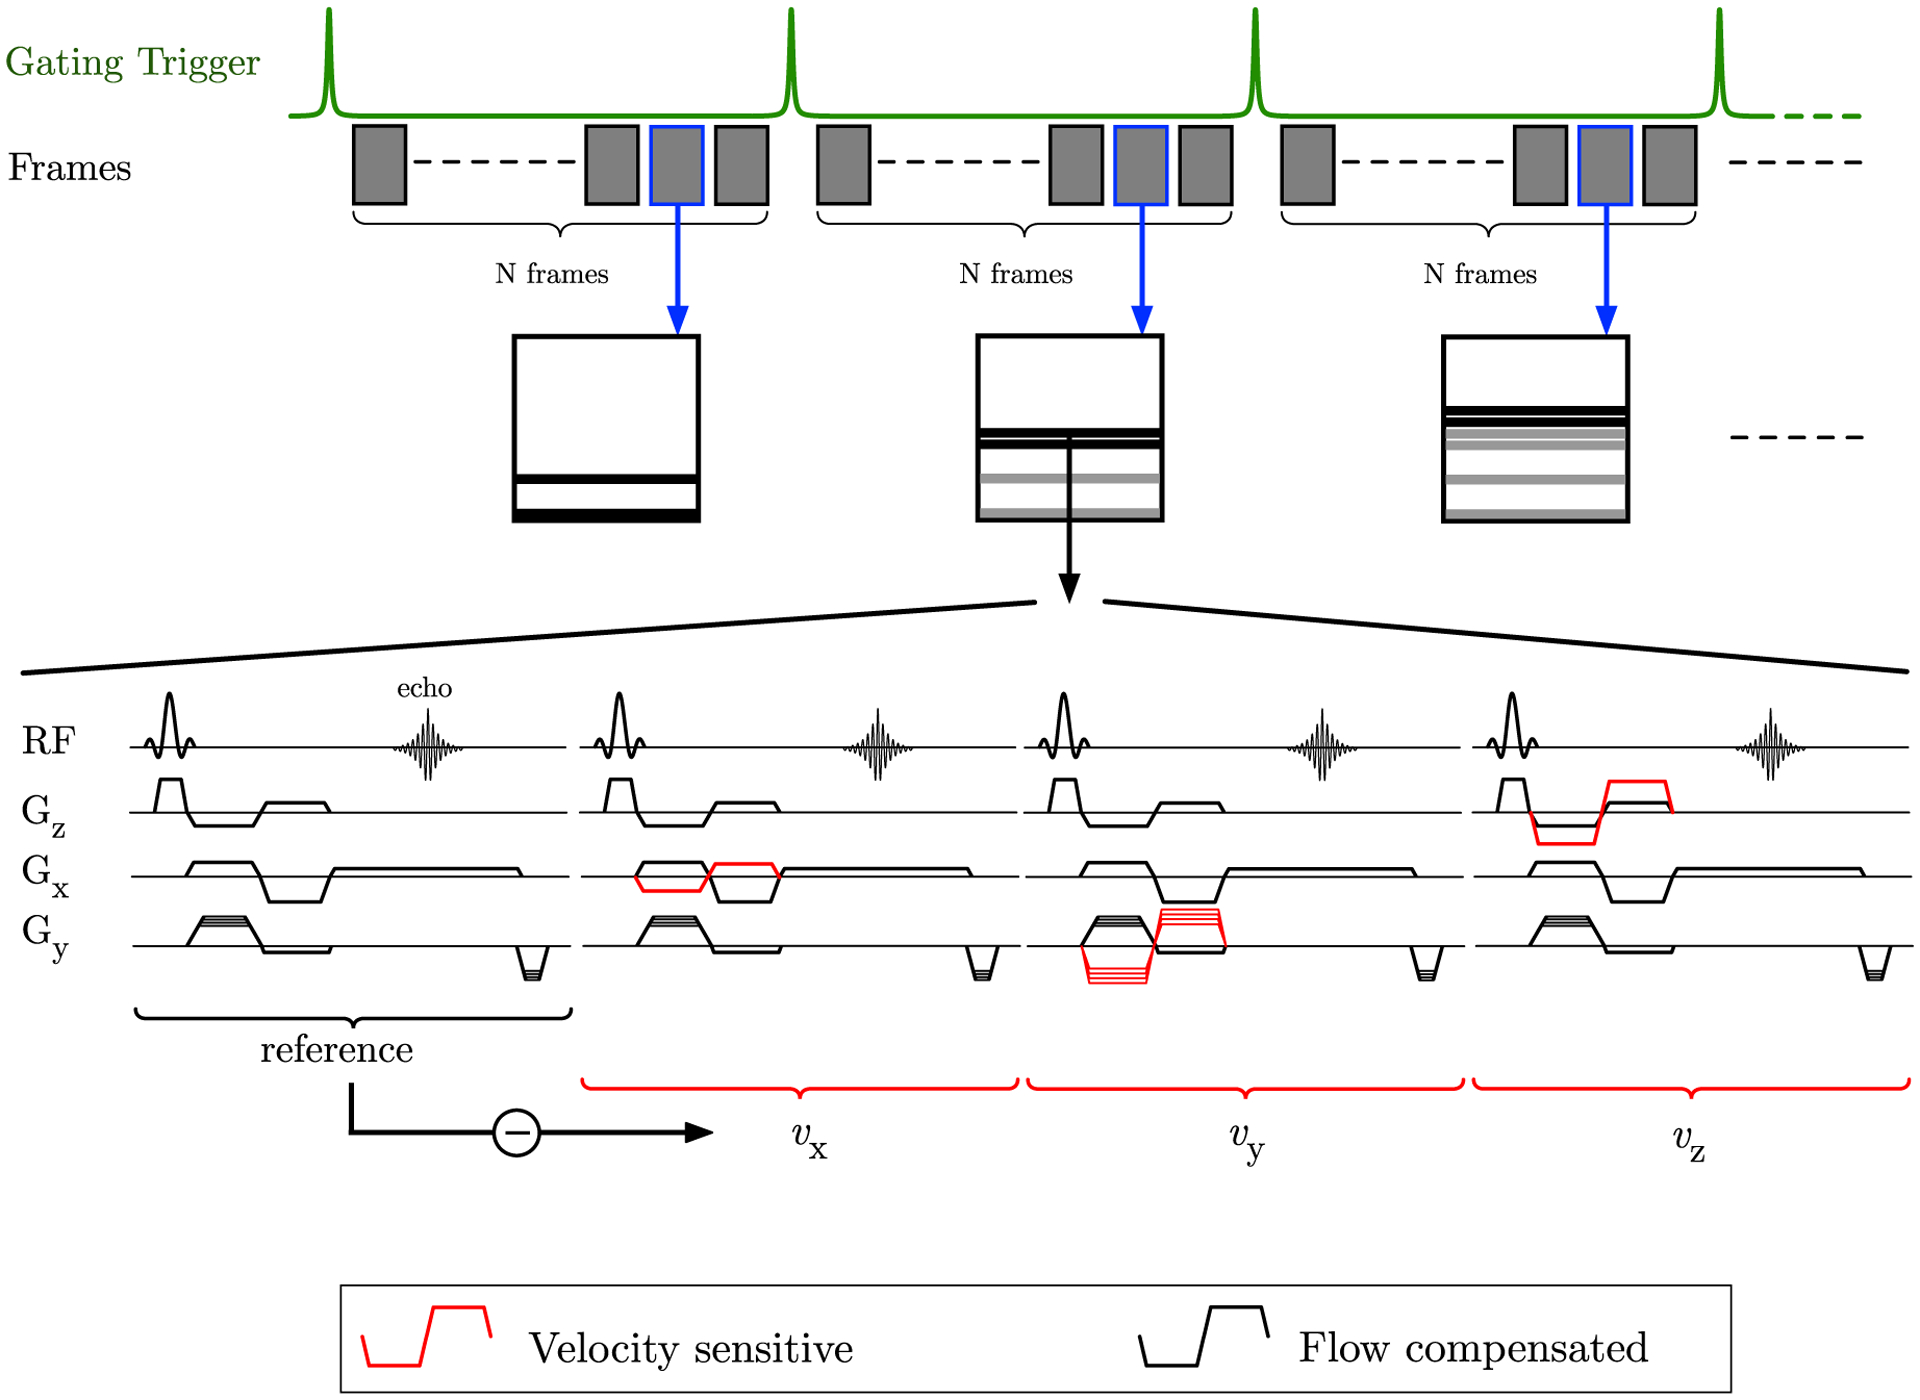
FIGURE 1.

Pulse sequence diagram of the VE-PC sequence; the gating trigger shown on the top row is the external trigger from the force transducer attached to the foot restraining device. Each shaded block is expanded below in the pulse sequence; the pulse sequence includes the reference flow compensated acquisition followed by 3 acquisitions, which are VE along the z, x, and y-axis, respectively. The vps denotes the number of PE lines acquired in a temporal frame, here vps = 2 (e.g., if vps is set to 2, the above sequence is repeated at 2 PE levels and the data are assigned to the temporal frame suggests that the PE lines go toward creating the image at that temporal frame). Higher vps result in lower temporal resolutions
