
FIGURE 9.
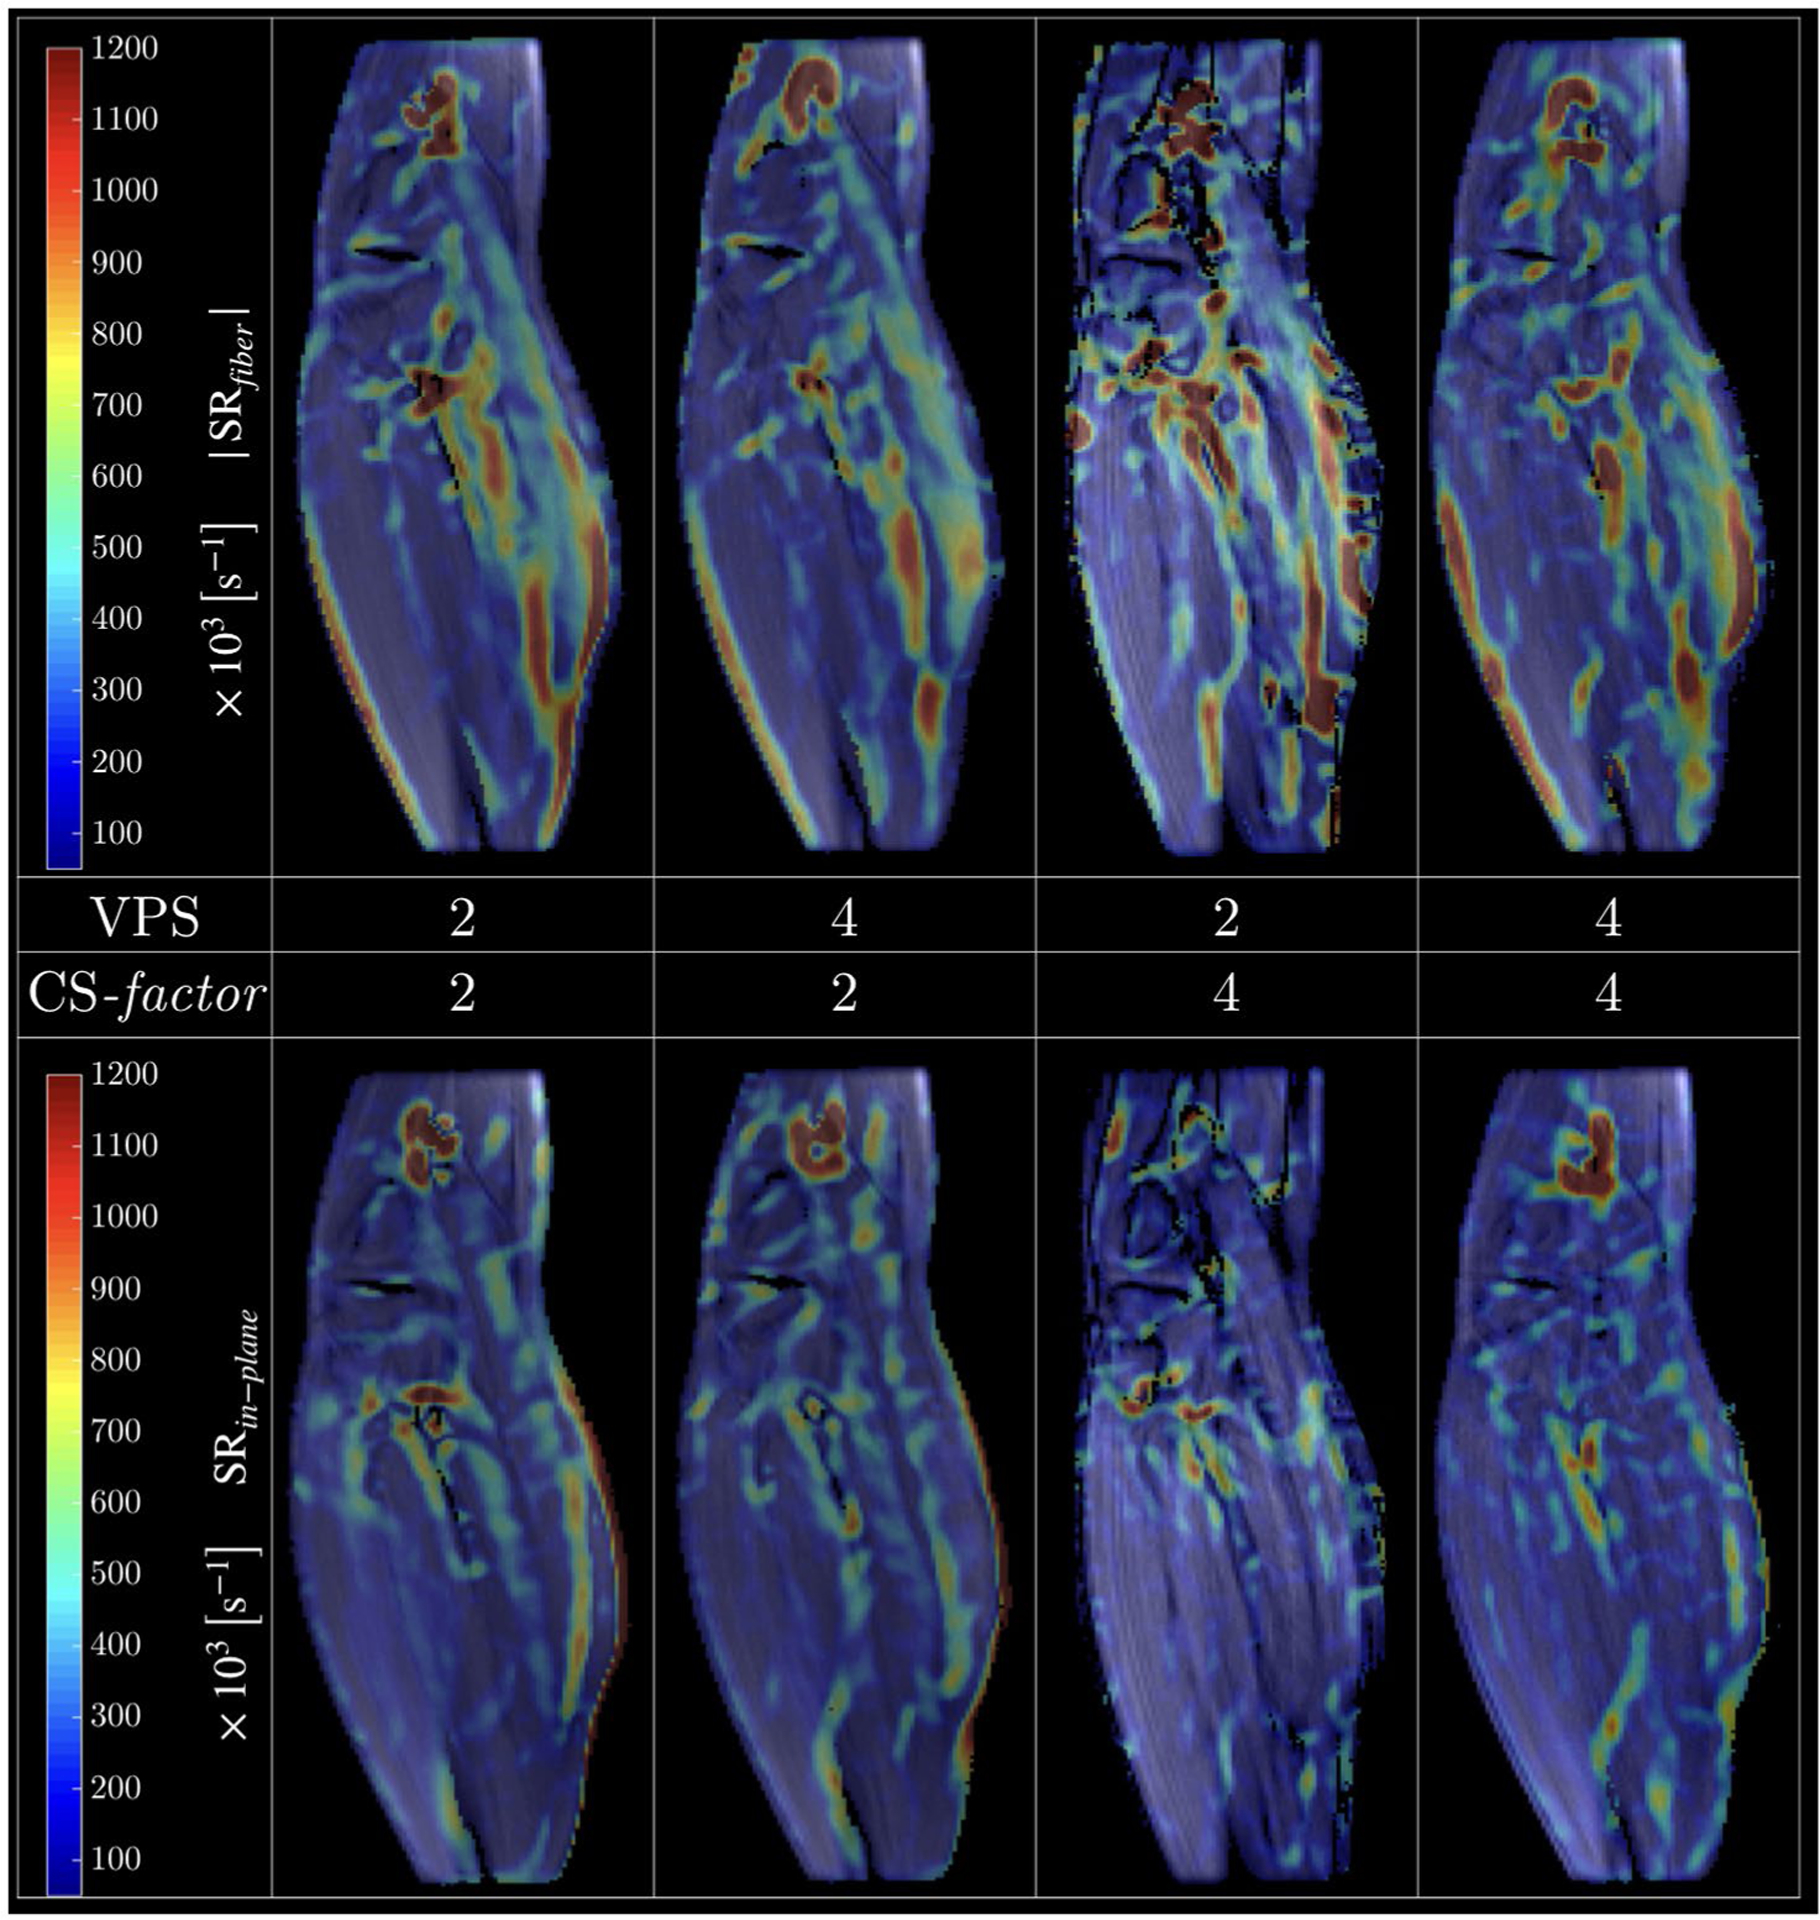
Absolute value SR tensor eigenvalue colormaps derived from velocity images for 4 different combinations of vps/CS-factor. The SRfiber (negative) and SRin-plane (positive) correspond to the SR maps along and perpendicular to the fiber direction, respectively; shown here is 1 temporal frame at the peak of the contraction phase for each CS scheme. The overall similarity of the colormaps as well as good image quality is evident for all the CS schemes. The colormaps will not be identical as each map is derived from a different acquisition and physiological/technical variabilities limit the exact reproducibility