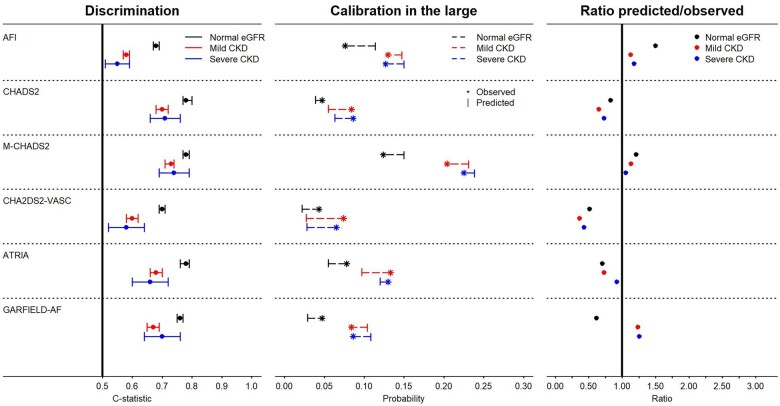
Figure 2.
Visualization of the predictive performance, stratified by three estimated glomerular filtration rate (eGFR) categories. CKD, chronic kidney disease. (Left) C-statistic (dot) with 95% confidence interval (bar). (Middle) Calibration in the large, showing the average observed (asterisk) and predicted (bar) probabilities of ischaemic stroke. (Right) The ratio of the predicted/observed risks—ratios above one indicate overprediction, ratios below one underprediction. Differences in the observed risks are due to the prediction timeframe of the validated risk scores and calculation methods (i.e. Cox or logistic).

