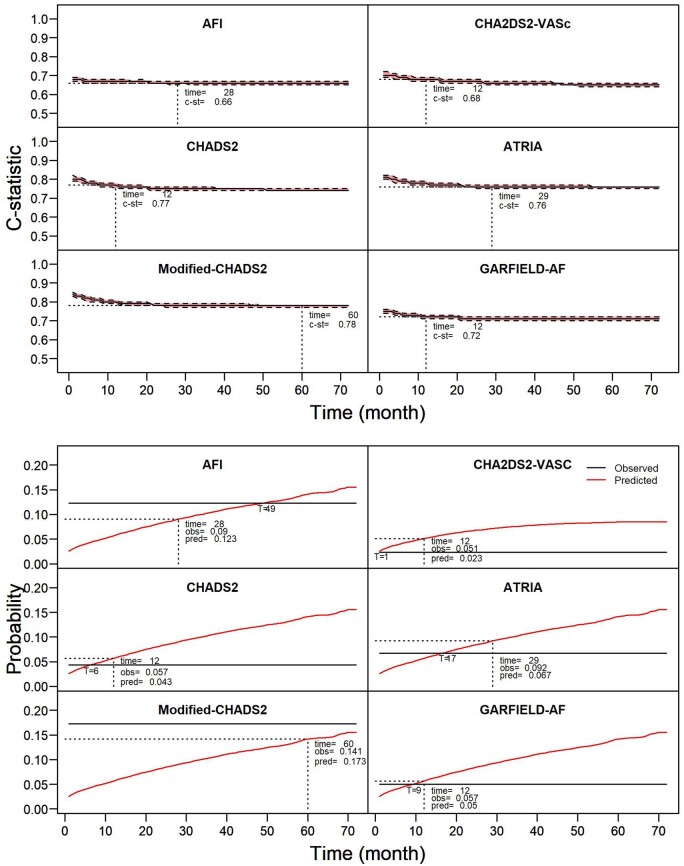
Figure 4.
Effect of prolonging the prediction timeframe on the predictive performance in patients with atrial fibrillation, not stratified for CKD stage. (Upper panel) The effect on discrimination (c-statistic with confidence interval); (lower panel) the effect on calibration in the large. Risk scores were validated 72 times; each time prolonging the prediction timeframe with 1 month until the maximum follow-up of 72 months was reached. Dotted cross-lines indicate the prediction timeframe for which the risk score was developed and the corresponding predictive performance, optimal calibration in the large indicated with T, followed by time in months. Stratification by chronic kidney disease stage is presented in Supplementary material online, Figures S9 and S10.

