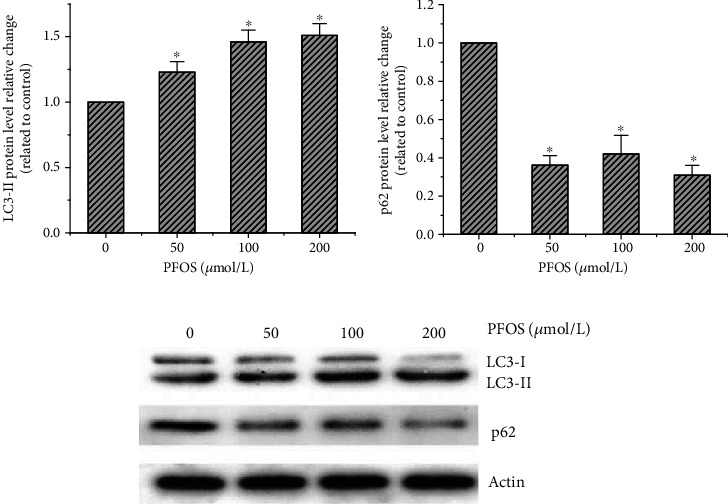
Figure 6.

Effect of PFOS on LC3-II/LC3-I and p62 protein levels: (a) LC3-II protein levels; (b) p62 protein levels; (c) representative western blotting lane. Values are represented as the mean ± S.D. (n = 3). ∗P < 0.05 compared with the control group.
