Figure 1.
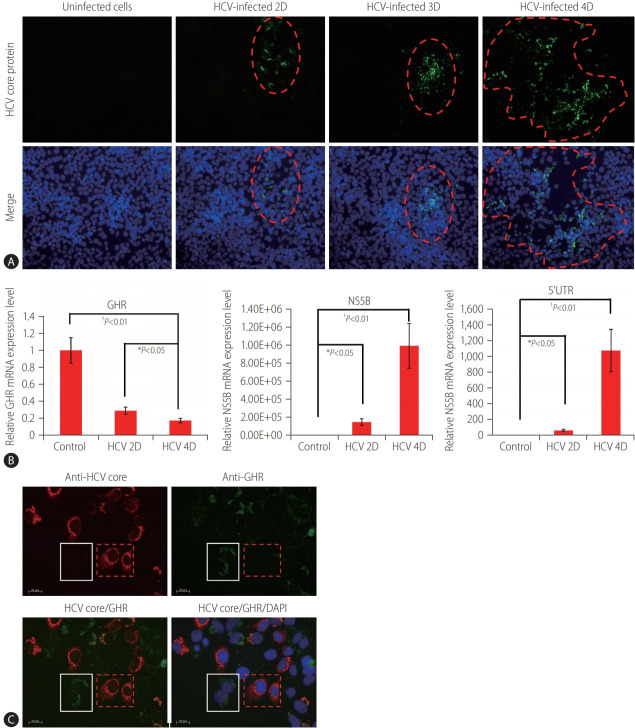
GHR expression in the HCV-infected Huh7.5.1 cell model. (A) The efficient production of infectious HCV gradually increased at different time points (2D, 3D, and 4D), as detected by immunostaining. Red dash line ranges indicate the HCV-infected cells. Anti-HCV core protein (green) and nuclei (DAPI, blue). (B) The expressions of HCV 5’UTR, NS5B, and GHR detected at different time points (2D, 3D, and 4D) in the HCV-infected Huh7.5.1 cells by RT-qPCR. The values indicate the mean±standard deviation for three separate experiments. (C) GHR was highly decreased in HCV-infected cells (red dash line squares), and white line squares indicate non-infected cells. Anti-HCV core protein (red), anti-GHR (green), and nuclei (DAPI, blue). HCV, hepatitis C virus; 2D, Day 2; 3D, Day 3; 4D, Day 4; GHR, growth hormone receptor; NS5B, nonstructural protein 5B; 5’UTR, 5’ untranslated region; DAPI, 4’,6-diamidino-2-phenylindole; RT-qPCR, quantitative real-time polymerase chain reaction. *P<0.05. †P<0.01.

