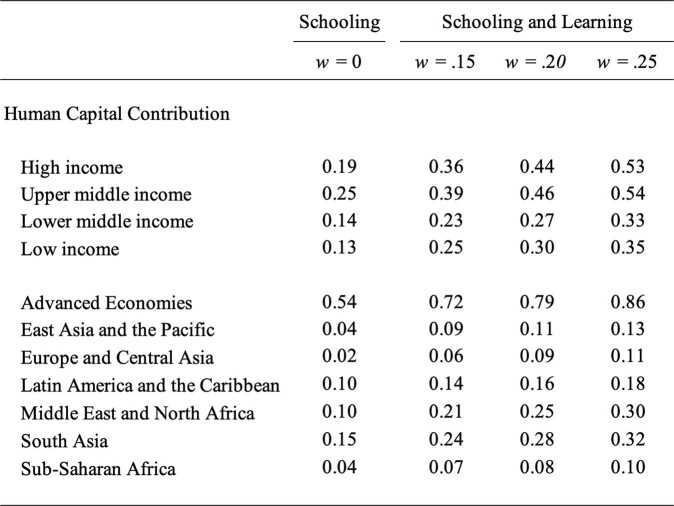
Extended Data Table 2.
Human capital share by income status and region
The variable y is real output per worker on average from 2000 to 2010; h is a measure of human capital constructed on the basis of both schooling and learning estimates on average from 2000 onwards. We include the following decomposition of the role of human capital in explaining cross-country income differences on the basis of the literature5–13: var(log[h]/var(log[y]). Variable constructions and decompositions are described in detail in the Methods. We assume rates of return to the learning component of human capital, defined as w, on the basis of the microeconomic literature42,43. We conduct sensitivity analyses with values w = 0.15, w = 0.20 and w = 0.25. When w = 0, our accounting de facto only includes schooling; for any value w > 0, we include learning as well as schooling. We include 131 countries in this development accounting exercise. Schooling data are from a previously published study32. GDP data on real output per worker are from Penn world tables v.9.014. Learning estimates are from our database.

