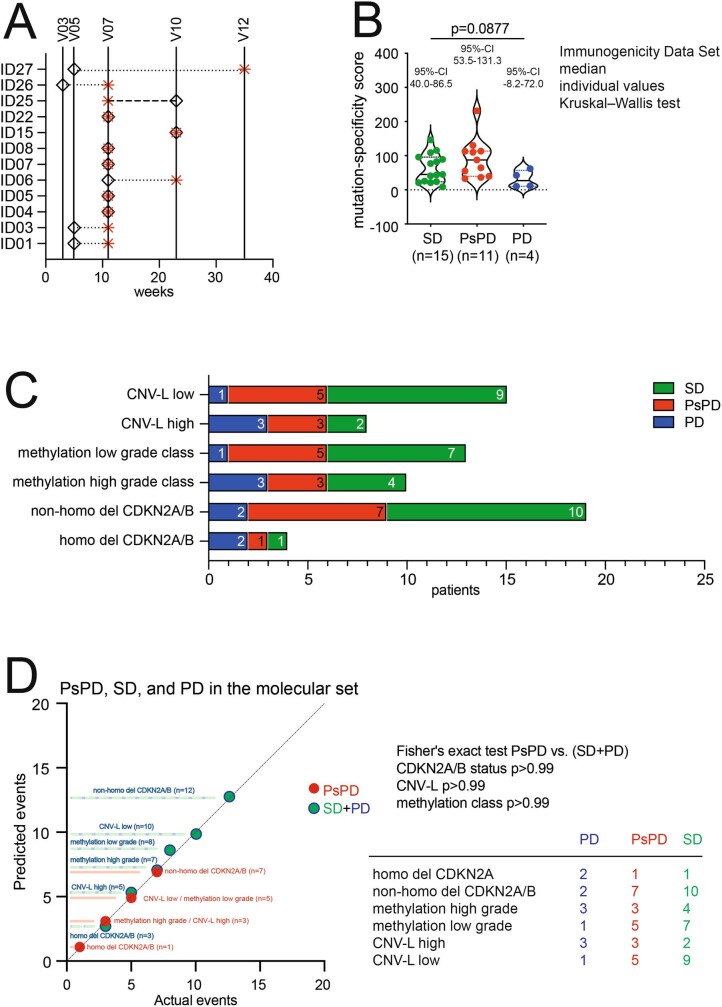
Extended Data Fig. 7. Determinants of pseudoprogression.
a, Time points of PsPD diagnosed by MRI and onset of early immune response are shown in weeks and study visits. Black diamond, onset of immune response; red asterisk, PsPD. Visits with immune monitoring (V03, V05, V07, V10, and V12) are depicted. MRI was performed at clinical screening, V07, V10, V12 and V13. The onset of an early immune response was defined as antibody titre ≥ 1:333 (B cell), and/or T cell response detectable after negative control subtraction. n = 12 patients with PsPD. b, Violin plots showing MSS according to disease progression. Solid line, median; dotted lines, quartiles. n(SD) = 15; n(PsPD) = 11; n(PD) = 4. Two-sided Kruskal–Wallis test with Dunn’s multiple comparison. c, Incidence of disease progression in patients with molecularly defined astrocytomas according to CNV-L, methylation class, and CDKN2A/B status. d, Correlation between predicted and actual occurrence of molecular markers in groups of disease outcomes. Two-sided Fisher’s exact test (PsPD versus SD + PD). n(all patients) = 23 (c, d).

