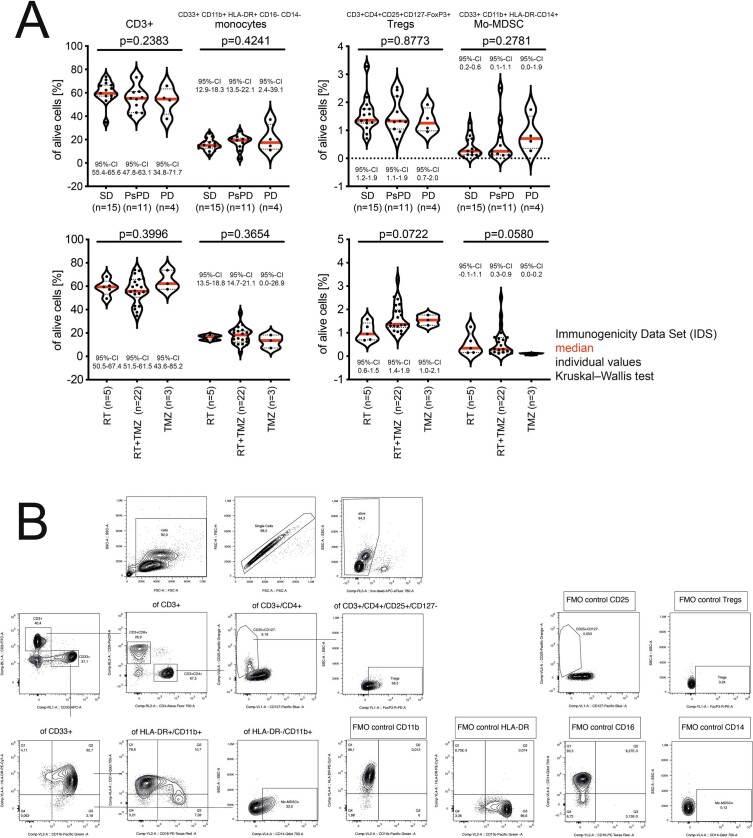
Extended Data Fig. 9. Outcomes, standard treatment and peripheral immune cell composition in the IDS.
a, Frequencies of T cells, monocytes, regulatory T cells (Tregs), and monocytic myeloid-derived suppressor cells (mo-MDSC) within PBMCs were determined at V07 by flow cytometry and are shown according to disease course at EOS (top) and SOC treatment (bottom). CD3+, T cells. n(SD) = 15; n(PsPD) = 11; n(PD) = 4; n(RT) = 5; n(RT + TMZ) = 22; n(TMZ) = 3. Red line, median; dotted lines, quartiles. Two-sided Kruskal–Wallis test with Dunn’s multiple comparison. b, Gating strategy for flow cytometric analysis.

