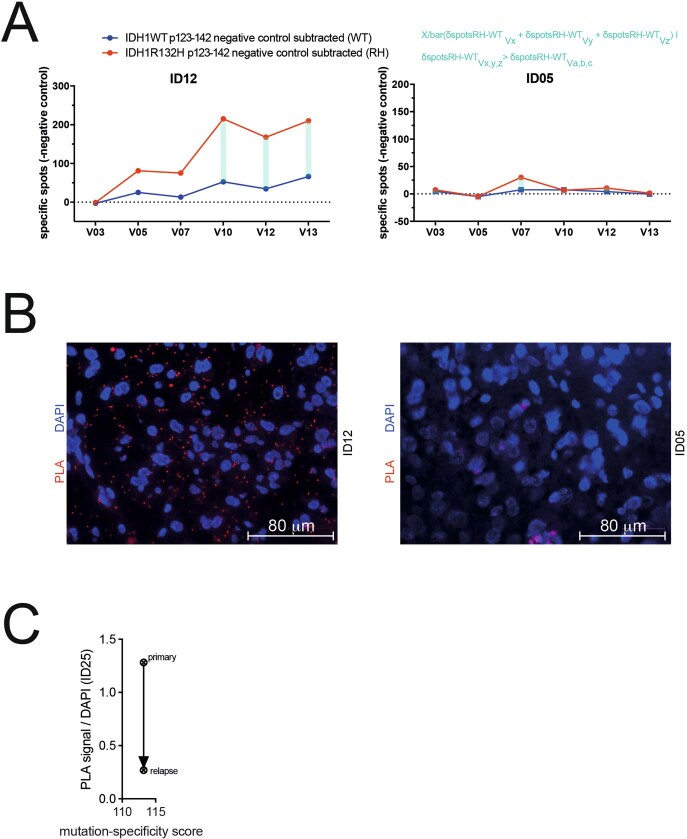
Extended Data Fig. 5. Definition of the MSS and PLA.
a, Exemplary MSS of patients ID12 and ID05. Mathematical differences between specific spot counts for IDH1(R132H) (red) and wild-type IDH1 (blue) are calculated (light blue) for all immunogenicity testing visits. MSS is defined as the sum of the three largest differences. For MSS of the IDS please refer to Supplementary Table 7. b, Exemplary PLA of patients ID12 and ID05. For relative PLA values of the IDS please refer to Fig. 2. Scale bars, 80 μm. PLA was performed once per patient. c, Relative PLA signals of primary and recurrent tissues from patient ID25.

