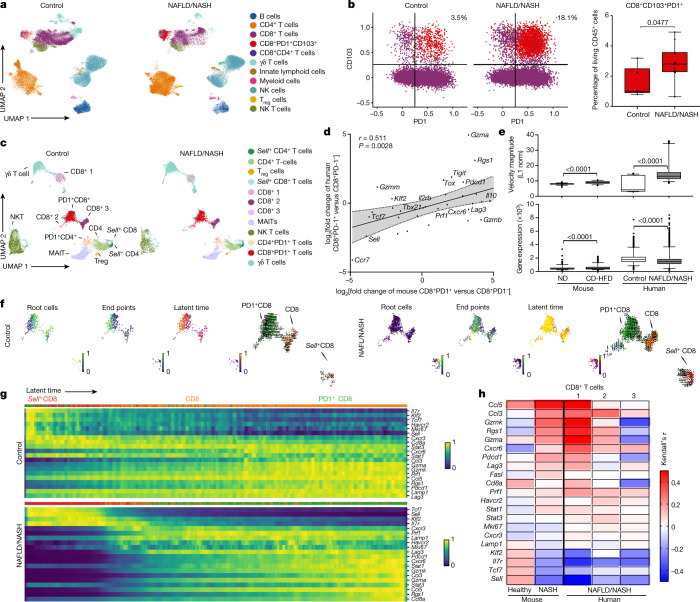
Fig. 3. Hepatic resident-like CD8+PD1+ T cells are increased in livers of patients with NAFLD patients.
a, b, UMAP representation showing the FlowSOM-guided clustering of CD45+ cells (a) and flow cytometry plots (b, left) and quantification (b, right) of CD8+PD1+CD103+ cells derived from hepatic biopsies of healthy individuals or patients with NAFLD or NASH (Supplementary Table 2). Populations in b: violet, CD8+; red, CD8+PD1+CD103+. Treg cells, regulatory T cells. c, UMAP representations and analyses of differential gene expression by scRNA-seq of CD3+ cells from control individuals or patients with NAFLD or NASH. MAITs, mucosal-associated invariant T cells. d, Correlation of significant differentially expressed genes in liver-derived CD8+PD1+ T cells compared to CD8+PD1− T cells from mice fed with CD-HFD for 12 months and patients with NAFLD/NASH. Shading shows 95% CI. e–h, Expression (e) and transcriptional activity (f) of velocity analyses of scRNA-seq data, and gene expression (g) and correlation (h) of expression along the latent-time of selected genes along the latent-time of liver-derived CD8+ T cells from patients with NAFLD or NASH in comparison to control or NASH mouse liver-derived CD8+ T cells. Root cells: yellow, root cells; blue, cells furthest from the root by RNA velocity. End points: yellow, end-point cells; blue, cells furthest from defined end-point cells by RNA velocity. Latent time (pseudo-time by RNA velocity): dark colour, start of RNA velocity; yellow, end point of latent time. RNA velocity flow (top): blue cluster, start point; orange cluster, intermediate; green cluster, end point. Arrow indicates cell trajectory. Details of sample sizes, biological replicates and statistical tests are given in Methods and Source Data. b, e, P values shown above brackets.

