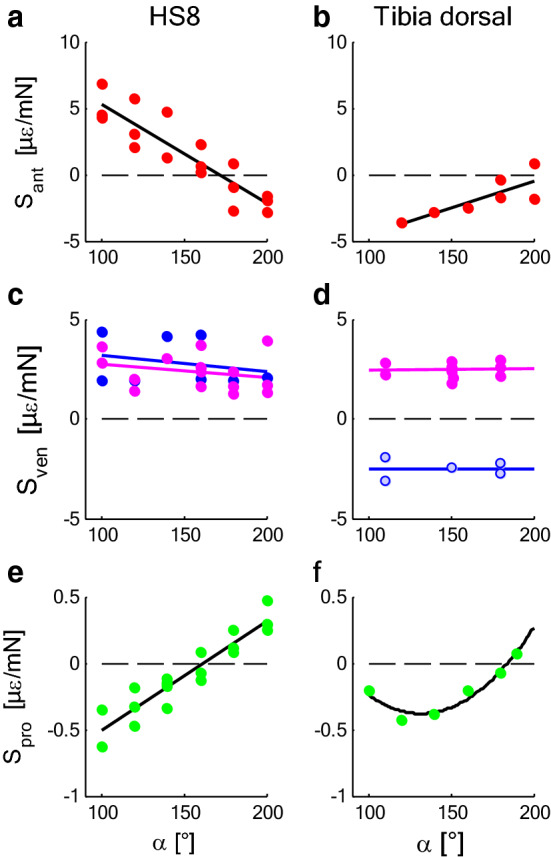
Fig. 2.

Mechanical sensitivity S in dependence of the joint angle α (s. Fig.1) at the site of the lyriform organ HS8 (left) and the dorsal tibia (right) of tarantulas. a, b Anteriad load, x (red). c, d Dorsad load, y—muscle force (magenta), ventrad load—hemolymph pressure (blue; light blue in d values with low force/pressure ratios). e, f Proximad load, z (green). Compression: S < 0 if load > 0, e.g., anteriad/ventrad/proximad load; compression: S > 0 if load < 0, e.g., posteriad/dorsad/distad load. a, c, e N = 3; b, d, f N = 1. Regressions for mechanical sensitivity S [µε/mN] (α [°]): a Sant = 12.77–7.44E−2 × α; b Sant = − 8.45 + 3.98E−2 × α; c Sven = 4.02–8.14E−3 × α (n.s.); Sdor = 3.35–6.33E−3 × α (n.s.); d see text, Sven = 2.33 + 7.61E−4 × α (n.s.); Sdor = − 2.53 + 1.95E−4 × α (n.s.); e Spro = − 1.33 + 8.22E−3 × α; f Spro = 2.03–3.66E−2 × α + 1.39E−4 × α2; (tarantula; data: Blickhan and Barth 1985). Note the different scales
