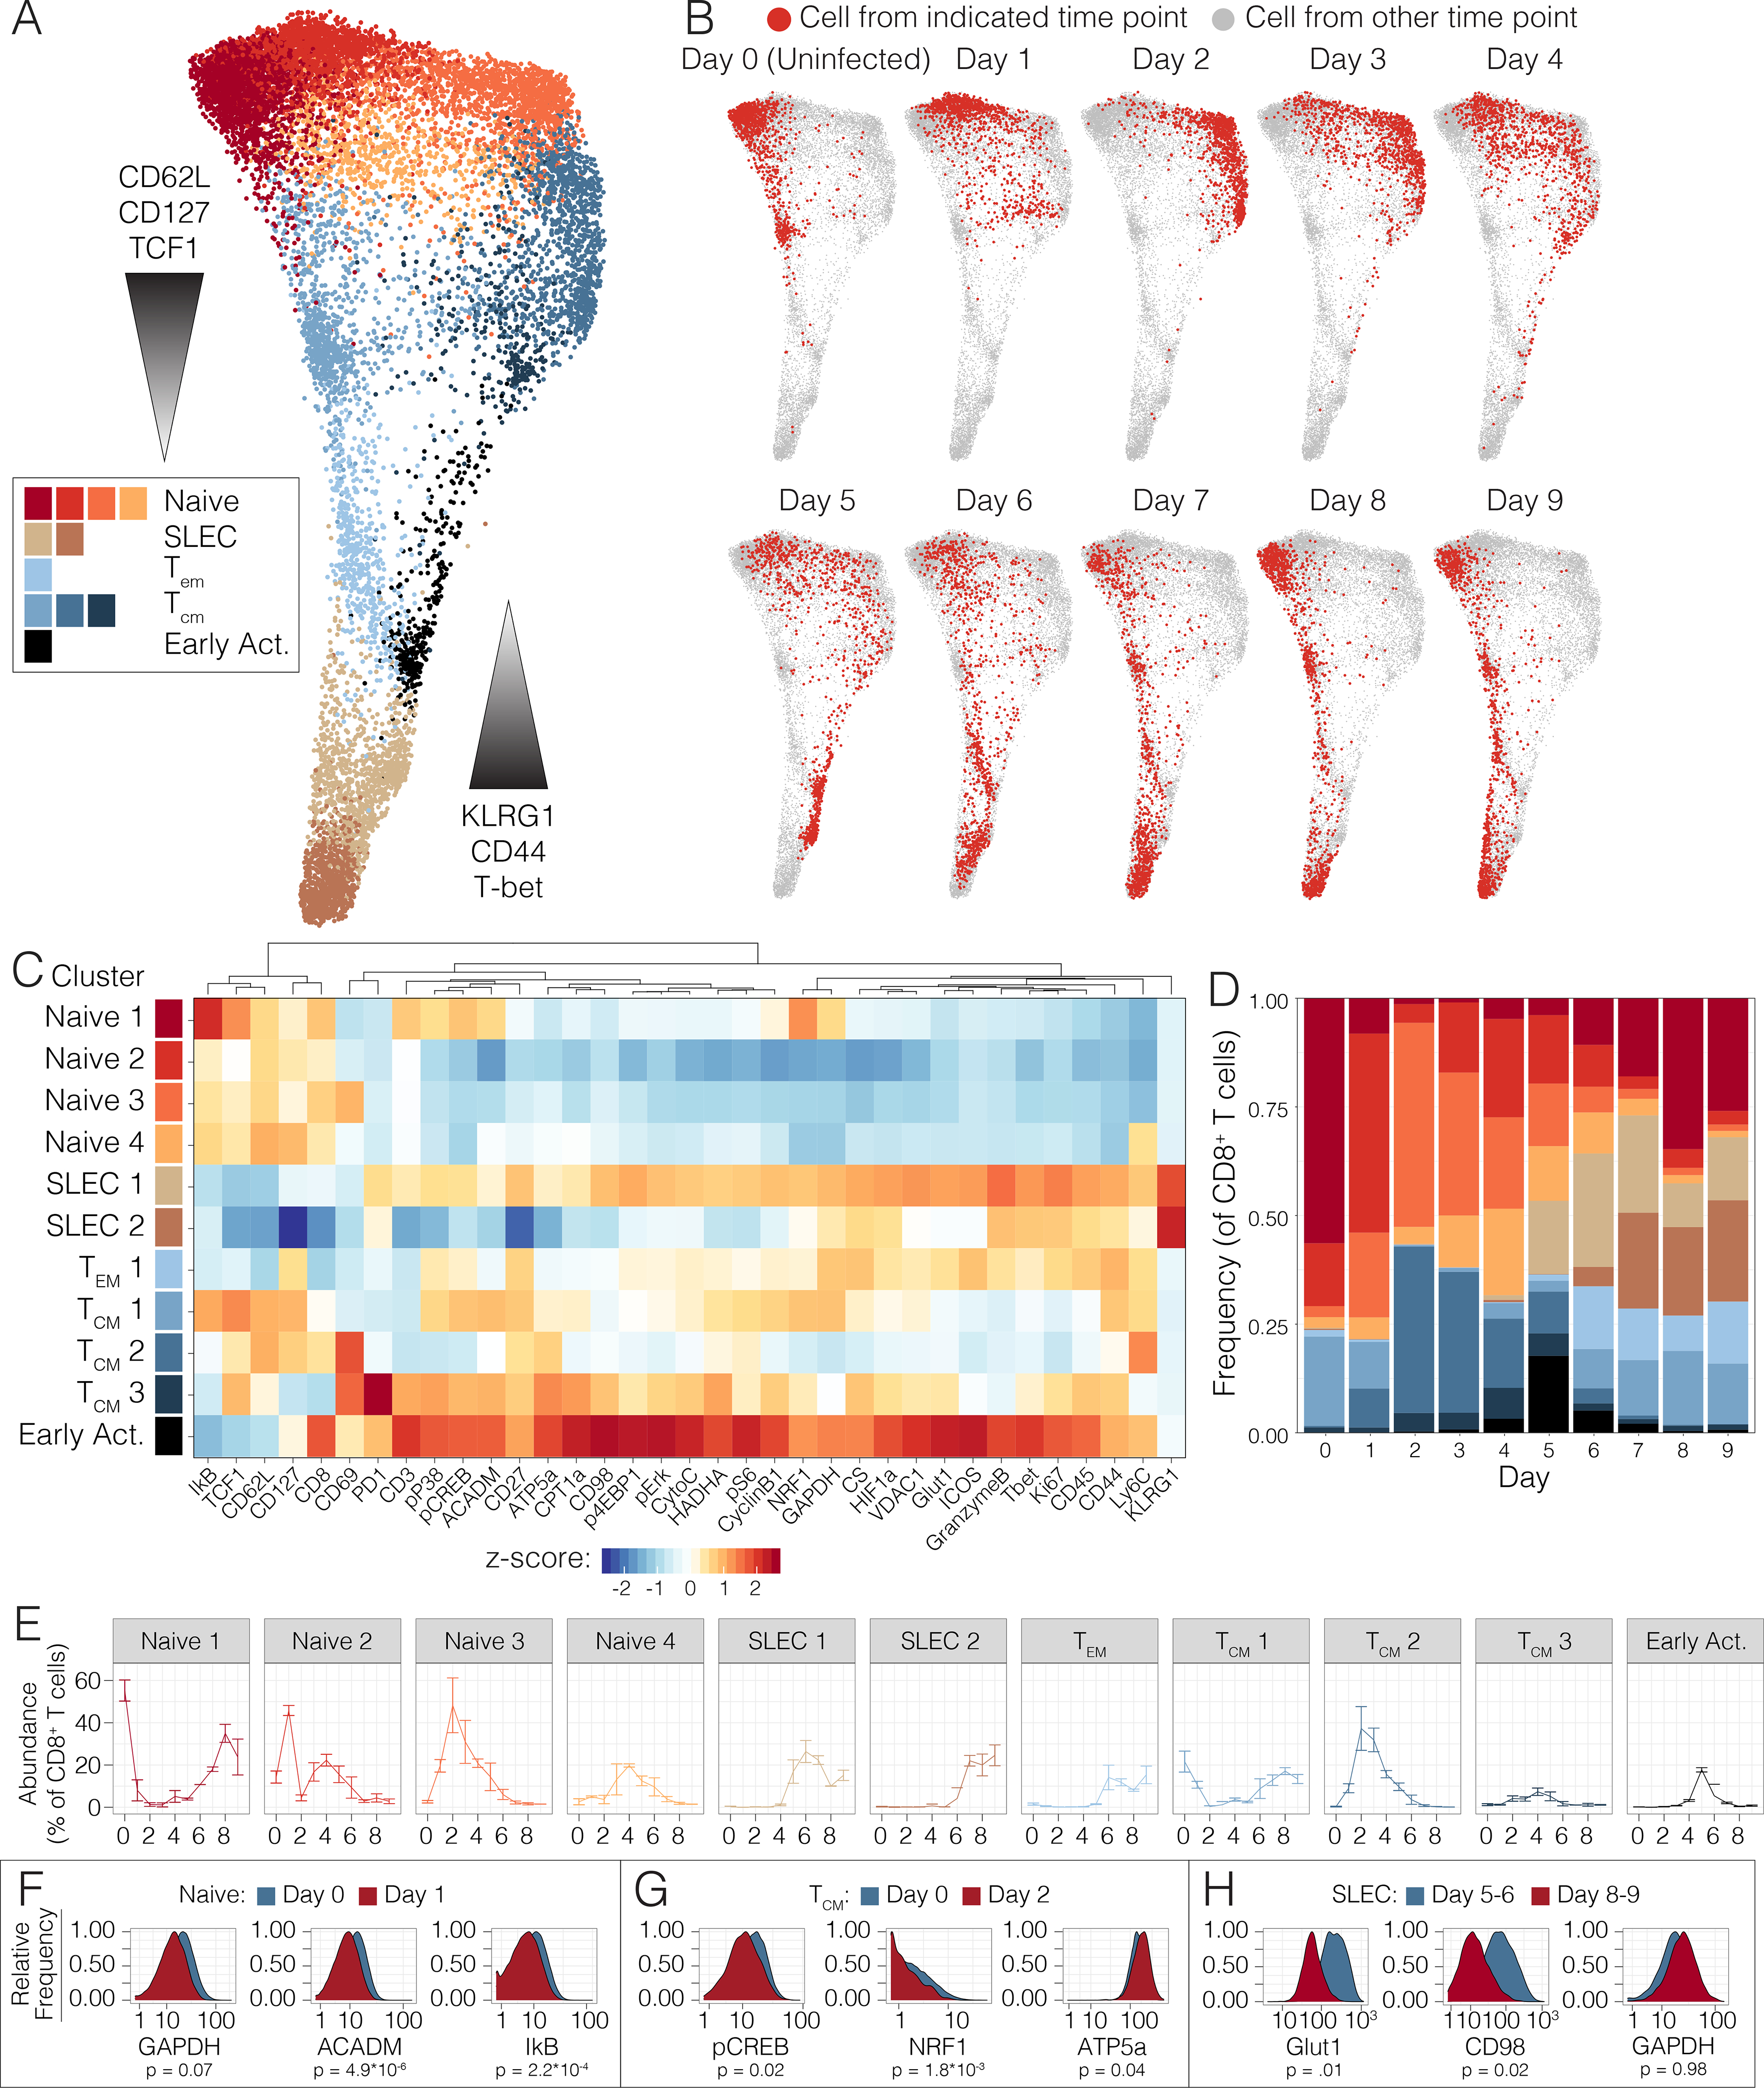
Figure 2. Single-cell analysis of the CD8+ T cell effector program in vivo.

(A) Pooled CD8+ T cells from mice at days 0 to 9 of Lm-OVA infection (n=2–3 mice per time point) clustered by Phenograph and visualized by a force-directed graph. (B) Force-directed graphs indicating cellular distribution by time point. (C) Functional and phenotypic median expression profiles for each CD8+ T cell cluster. (D) Cluster proportion by time point. (E) Individual cluster frequency profiles at days 0 to 9 p.i. Error bars represent SEM. (F) Expression profiles of metabolic and signaling in naïve clusters between days 0 and 1 p.i. (G) Expression profiles of central memory cells between days 0 and 2 p.i. (H) Metabolic expression profiles of SLEC clusters between days 5–6 and 8–9 p.i. Significance analysis of all medians by two-tailed student’s t-test (p<0.05 *, p<0.01 **) is displayed.
