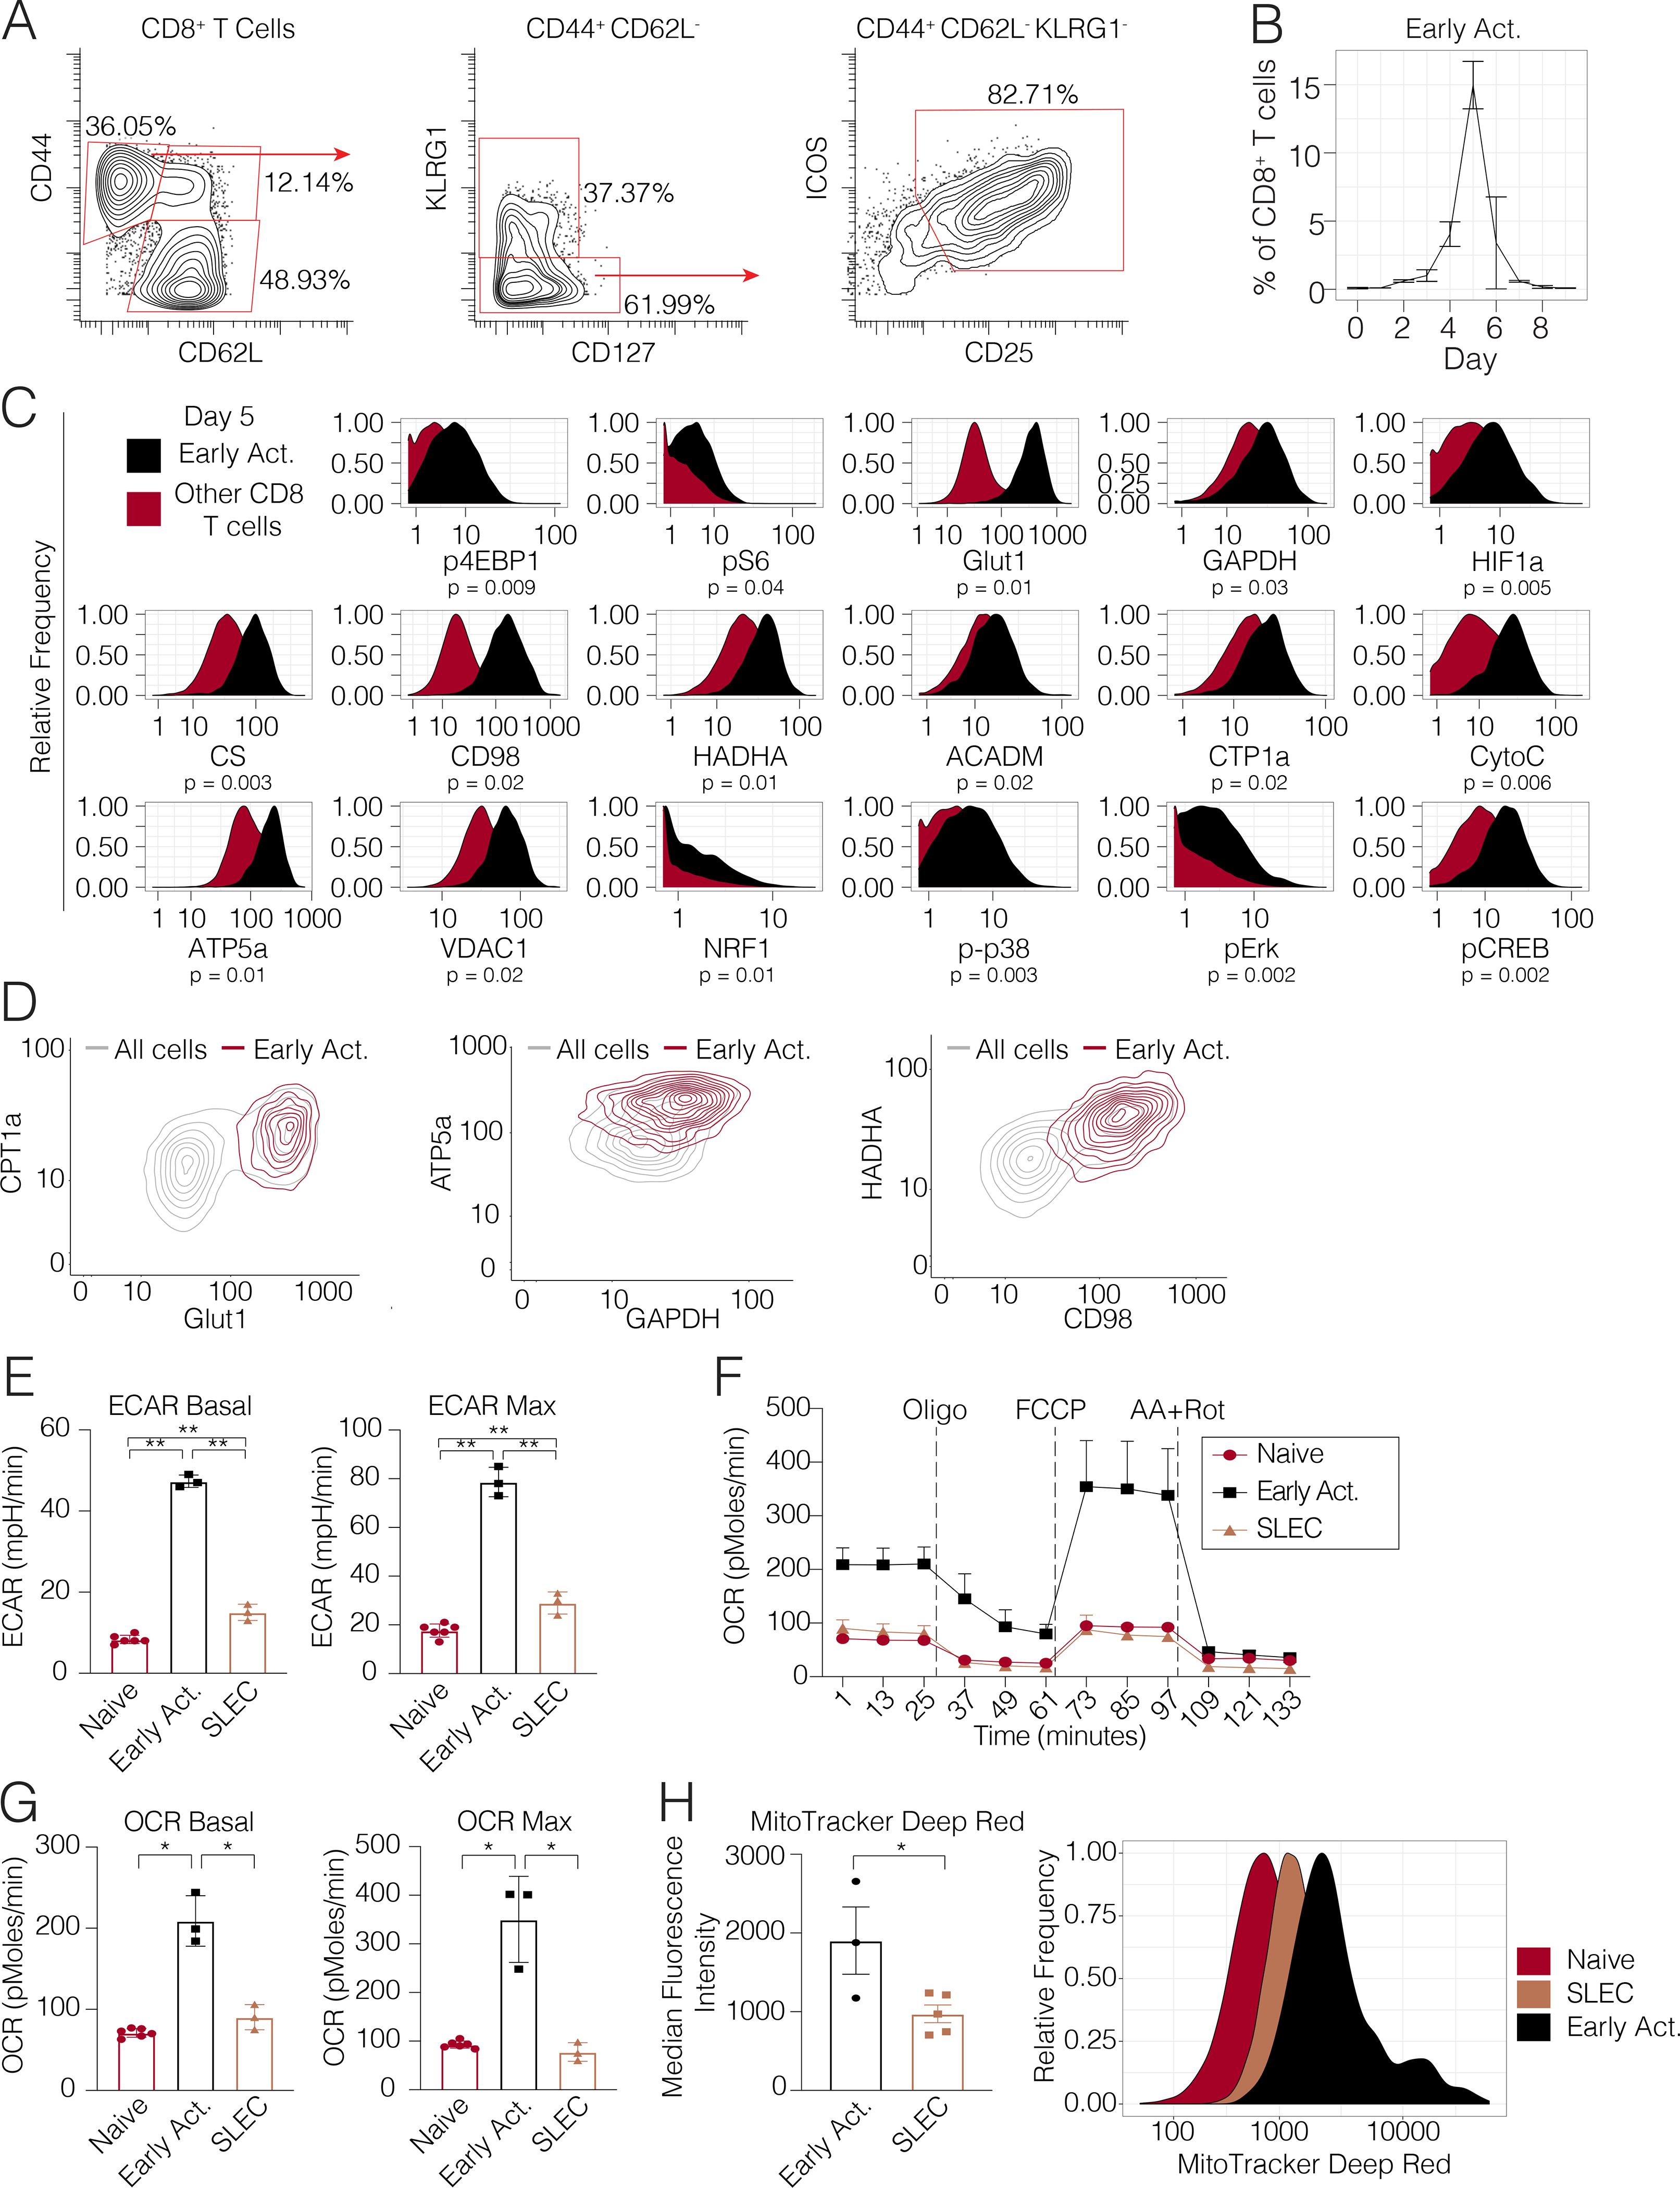
Figure 3. Early activated T cells exhibit a distinctive metabolic profile characterized by peak oxidative and glycolytic activity.

(A) Biaxial scatter plots indicating surface marker expression profile of the early activated T cell pool. (B) Frequency of early activated cells during days 0 to 9 p.i. (C) Metabolic expression profiles of metabolic and signaling markers in early activated T cells in comparison to all other CD8+ T cells during days 0 to 9 p.i. as depicted by histograms. Significance analysis of all medians by paired two-tailed student’s t-test (p<0.05 *, p<0.01 **) is displayed. (D) Scatterplots denoting the expression of proteins involved in glycolysis, long-chain fatty acid oxidation, oxidative phosphorylation and branched-chain amino acid metabolism in early activated CD8+ T cells on day 5 p.i. (E-G) CD8+ T cell subsets of interest were sorted on days 5 (naïve cells, early activated cells) and 8 (SLECs) p.i. and analyzed by Mitochondrial Stress Test (n=5 mice per time point). (E) Basal ECAR and maximal ECAR measured upon oligomycin administration. (F) OCR over time. (G) Basal and maximal OCR readings obtained upon FCCP administration. (H) MitoTracker signal in each subset (n=5 mice per subset). Significance analysis by paired two-tailed student’s t-test (p<0.05 *, p<0.01 **). Error bars represent SEM. Data are representative of at least 2 independent experiments.
