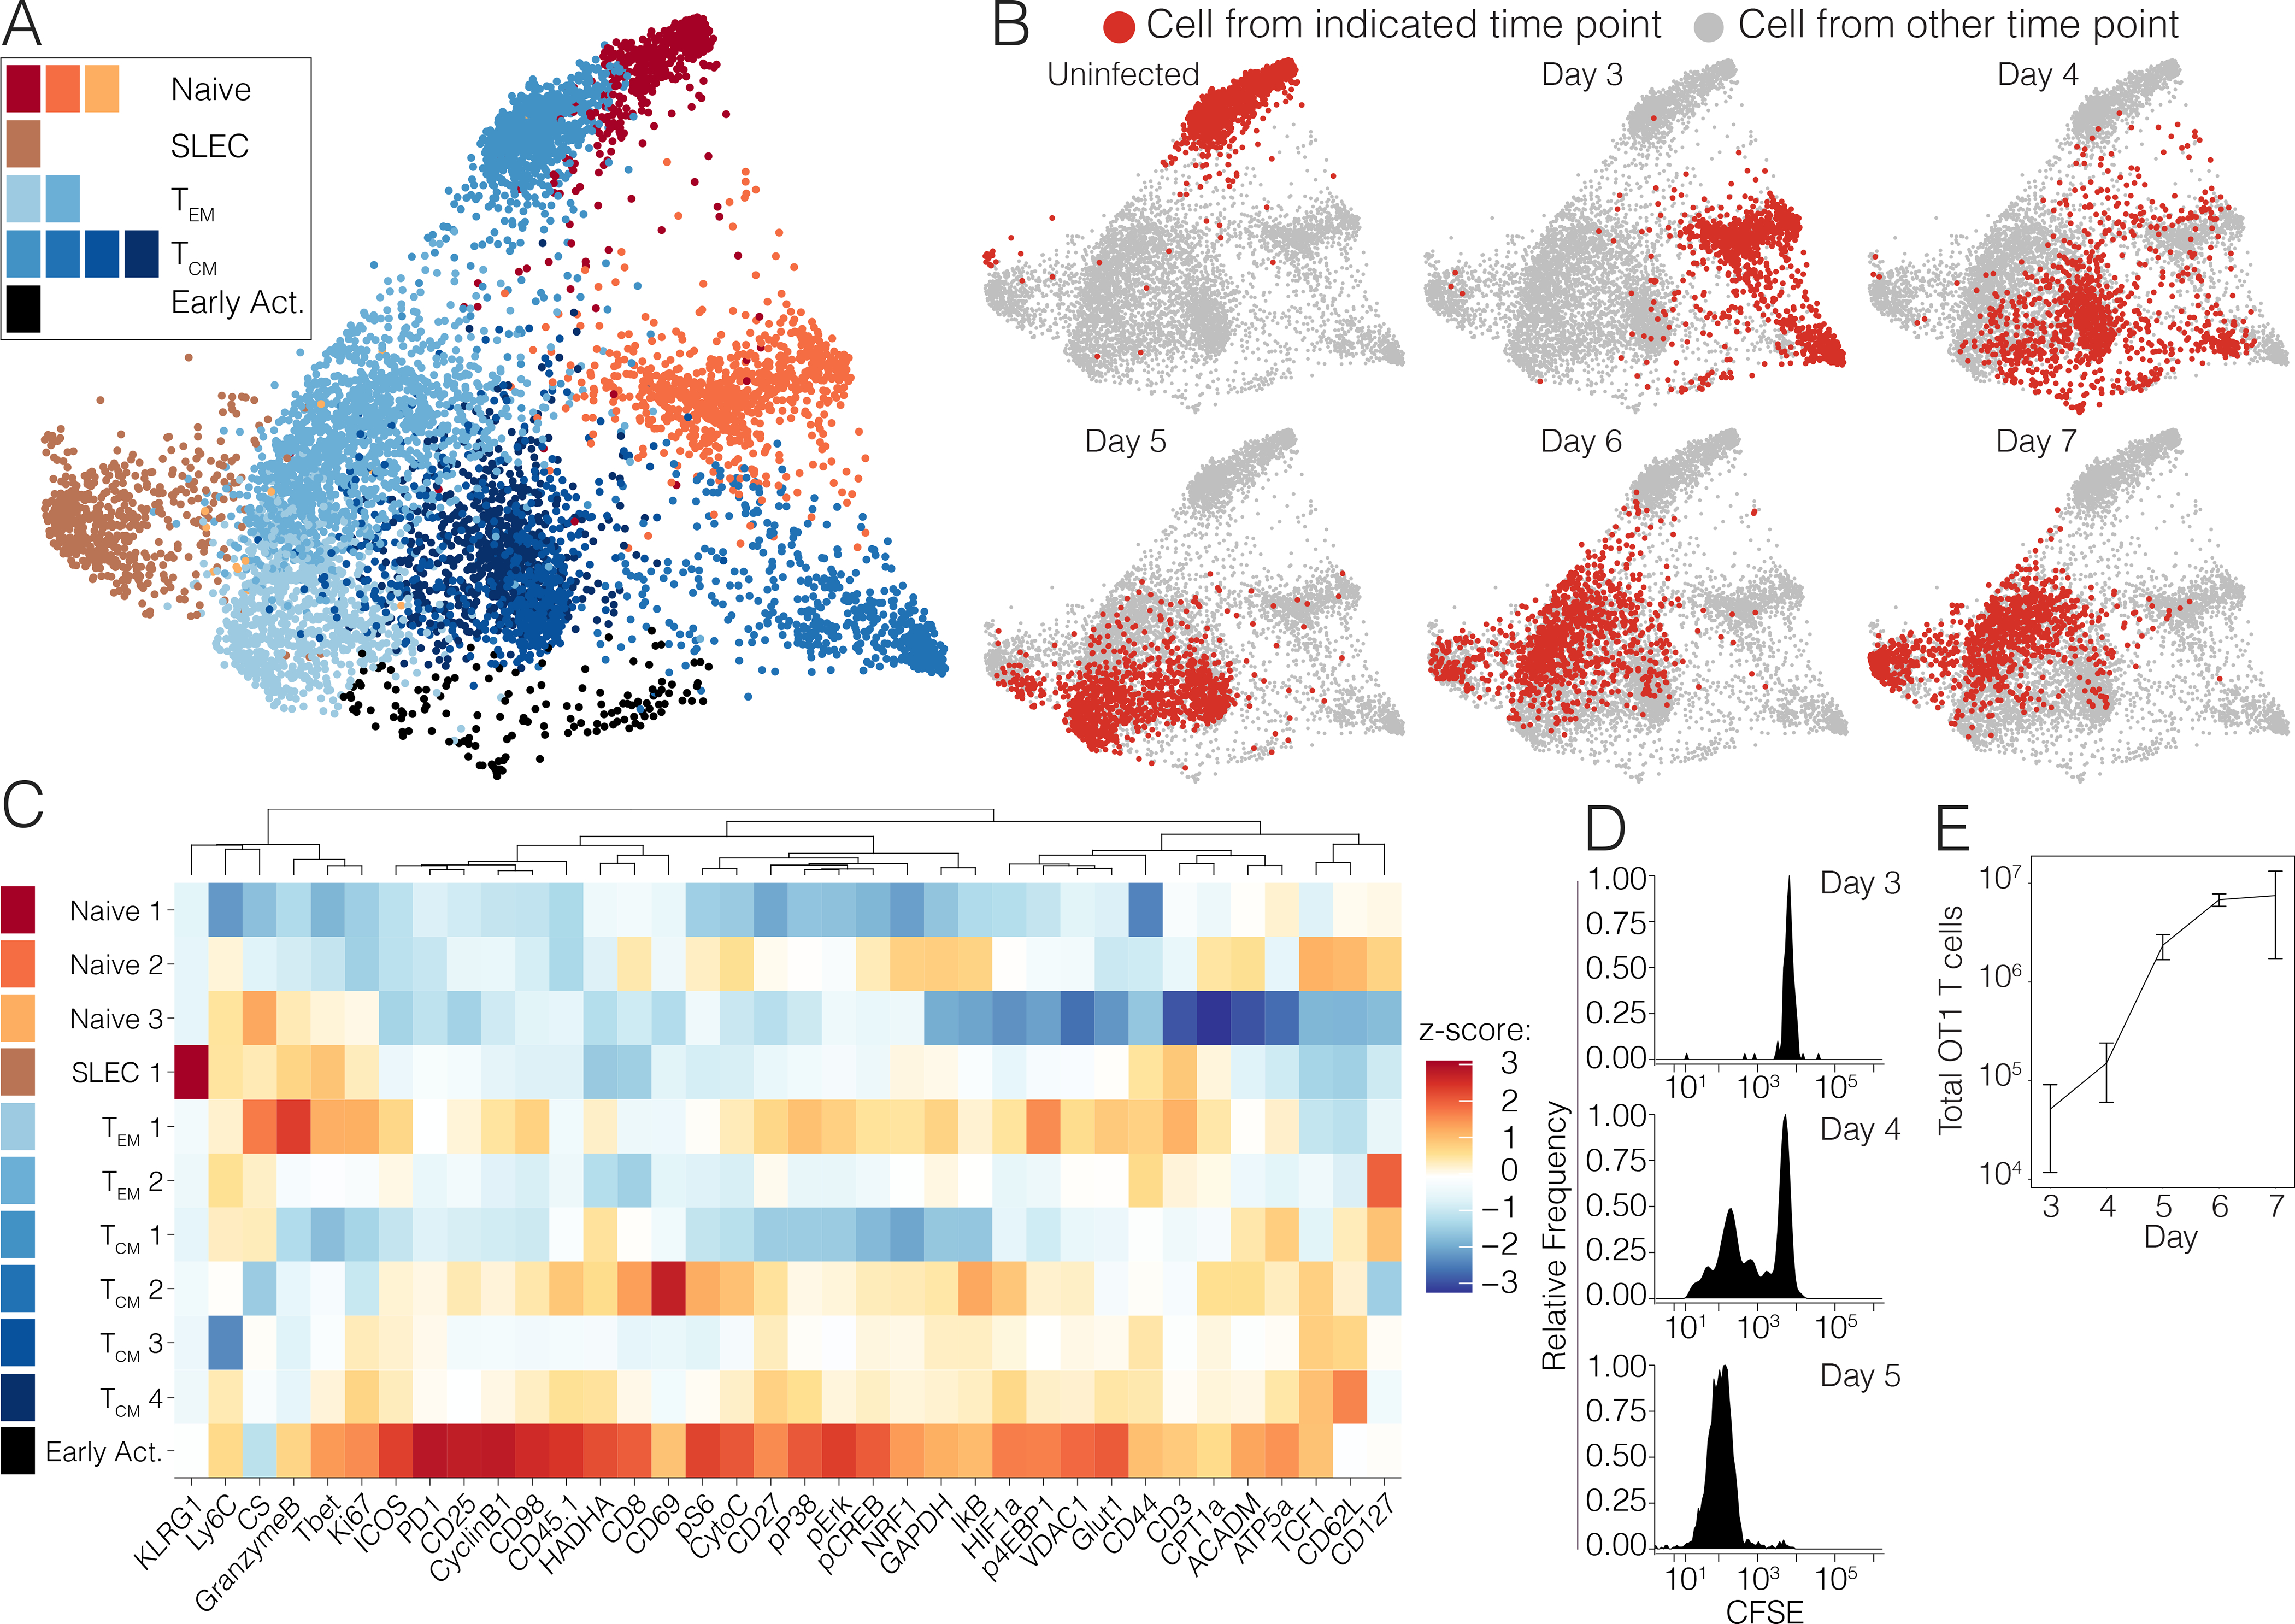
Figure 4. Antigen-specific CD8+ T cells transit through the early activated metabolic state.

OT-1 T cells pooled from 3 naive mice were adoptively into congenic hosts, which were then infected with 5*104 CFU Lm-OVA. Splenocytes were harvested daily on days 3 through 7 p.i for metabolic analysis by mass cytometry. (A) Pooled OT1 cells from uninfected mice or after transfer into recipient mice and on days 3 to 7 after Lm-OVA infection (n=3 mice per time point except day 3 (n=1)) clustered by Phenograph and visualized by a force-directed graph. (B) Force-directed graphs indicating cellular distribution by time point. (C) Functional and phenotypic median expression profiles for each CD8+ T cell cluster. (D) Proliferation of adoptively transferred OT1s as measured by CFSE dilution at days 3–5 p.i. and (E) absolute cell counts at days 3–7 p.i.
