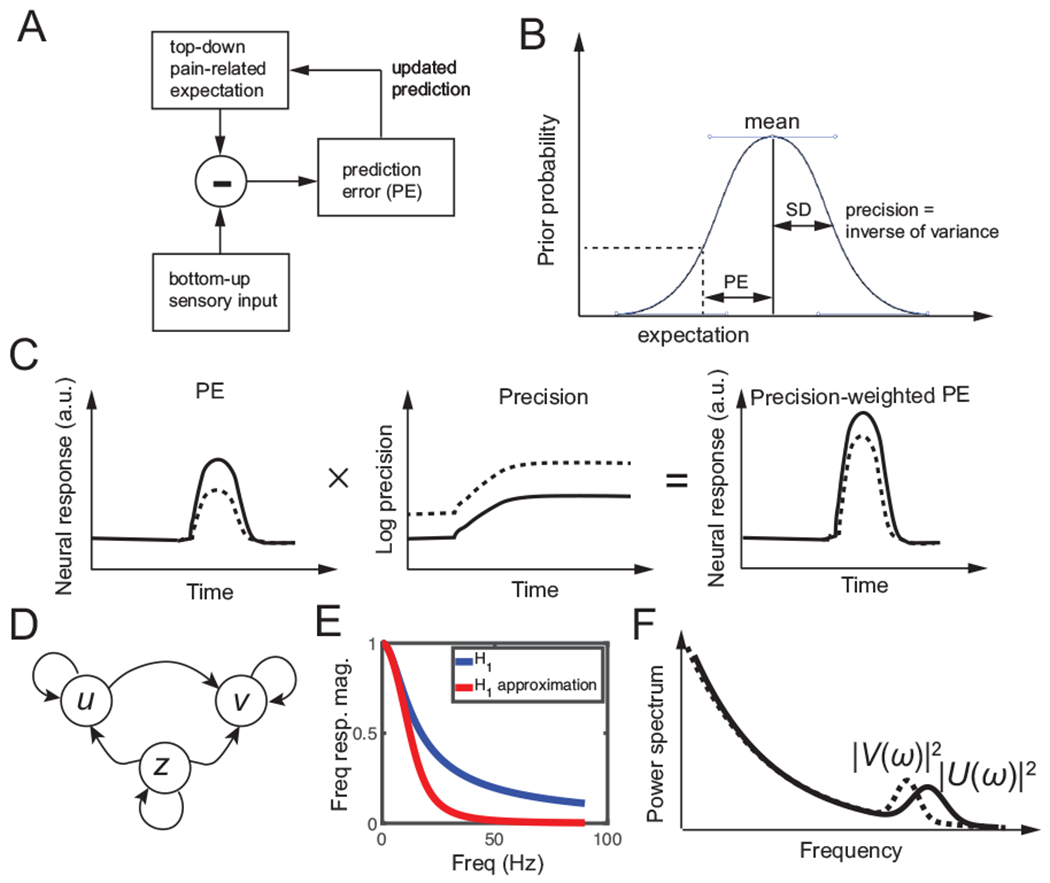
Fig. 1:

Predictive coding. (A) Schematic diagram of predictive coding for pain perception. (B) Graphical illustration of prediction error (PE), prior expectation, and prediction in perceptual inference. Due to the uncertainty of the top-down expectation, PE is assumed to be Gaussian distributed. Mean and standard deviation (SD) characterize the uncertainty of a Gaussian random variable. (C) Schematic illustration of neural response (a.u.) representing a gain-weighted PE that changes in time, where the gain is the precision statistic. (D) Graphical model showing statistical dependencies between the observed variables {u, v} and the latent variable {z} in the predictive coding model. Here, z denotes the pain expectation, and u and v denote the observed neural responses at two brain areas. (E) The magnitude of frequency response H1(ω) and its approximation, which can be viewed as a low-pass filter. (F) Schematic illustration of power spectra |U(ω)|2 (solid line) and |V(ω)|2 (dashed line), where U(ω) and V(ω) are the Fourier transforms of u(t) and v(t) in the predictive coding model, respectively.
