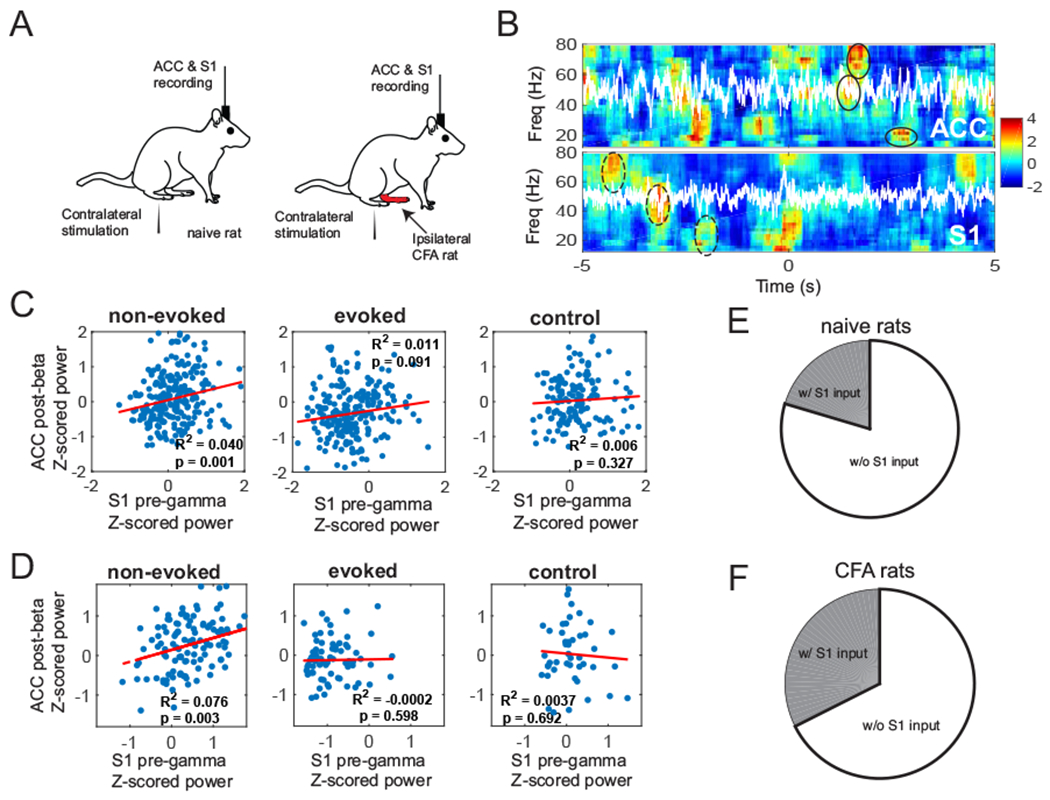
Fig. 3:

Results excerpted from our previous experimental findings. (A) Schematic diagram of noxious stimulation and electrophysiological recording in naive and CFA rats. (B) Z-scored spectrograms in the ACC and S1 during a representative non-evoked nociception episode. White traces show the principal component of multichannel LFPs. Time 0 marks the onset of non-evoked nociception event. The post-event, power was Z-scored with respect to [−5, 0] s, whereas the pre-event, power was Z-scored with respect, to [0, 5] s. The S1-ERD during the pre-event, period and the ACC-ERS during the post-event, period were highlighted by dashed and solid ellipses, respectively. (C) Time-averaged Z-scored pre-gamma. S1 activity vs. post-beta. ACC activity (n = 252 non-evoked nociception events, n = 233 evoked pain events; n = 149 negative controls), for naive rats. In each panel, R-square (i.e., the square of Pearson’s correlation) and p values are reported. (D) Same as panel C, except, for CFA rats (n = 127 non-evoked nociception events, n = 71 evoked pain events; n = 49 negative controls). (E) Pie chart, of pain-responsive ACC neurons that receive a direct S1 input, for naive rats. (F) Same as panel E, except, for CFA rats.
