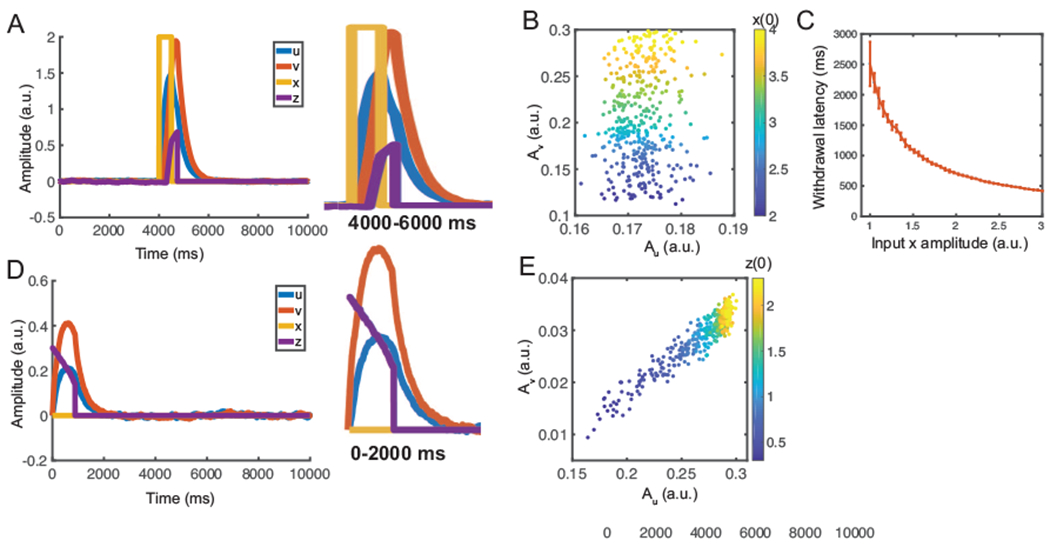
Fig. 4:

Simulation results from the predictive coding model. (A) Simulated 10-s temporal traces of {x, z, u, v} in evoked pain. Y-axis is in arbitrary unit (a.u.). Stimulus onset separates the pre-event, from post-event, periods. Here, we used u(0) = v(0) = z(0) = 0. The right, panel shows the zoom-in window of 4000-6000 ms. (B) The correlation of Au (area, under u-curve) and Av (area, under v-curve) was small during evoked pain. Each point, was derived from a simulation with a different, input, amplitude (correlation: 0.097, p = 0.06, n = 400). The Au and Av represent, the proxy of average induced responses in the gamma, and beta, bands. Each point, was derived from a simulation with a different z(0). (C) Reset, (withdrawal) latency decreases with increasing input, amplitude. Error bar represents the standard error of mean (SEM) (n = 50). (D) Simulated temporal traces of {x, z, u, v} in non-evoked nociception. Y-axis is in a.u. Here, we used u(0) = v(0) = 0, z(0) = 0.3. The right panel shows the zoom-in window of 0-2000 ms. (E) Au (during the pre-event period) was positively correlated with Av (during the post-event period). Each point, was derived from a simulation with a different z(0) (correlation: 0.947, p < 10−10, n = 400).
