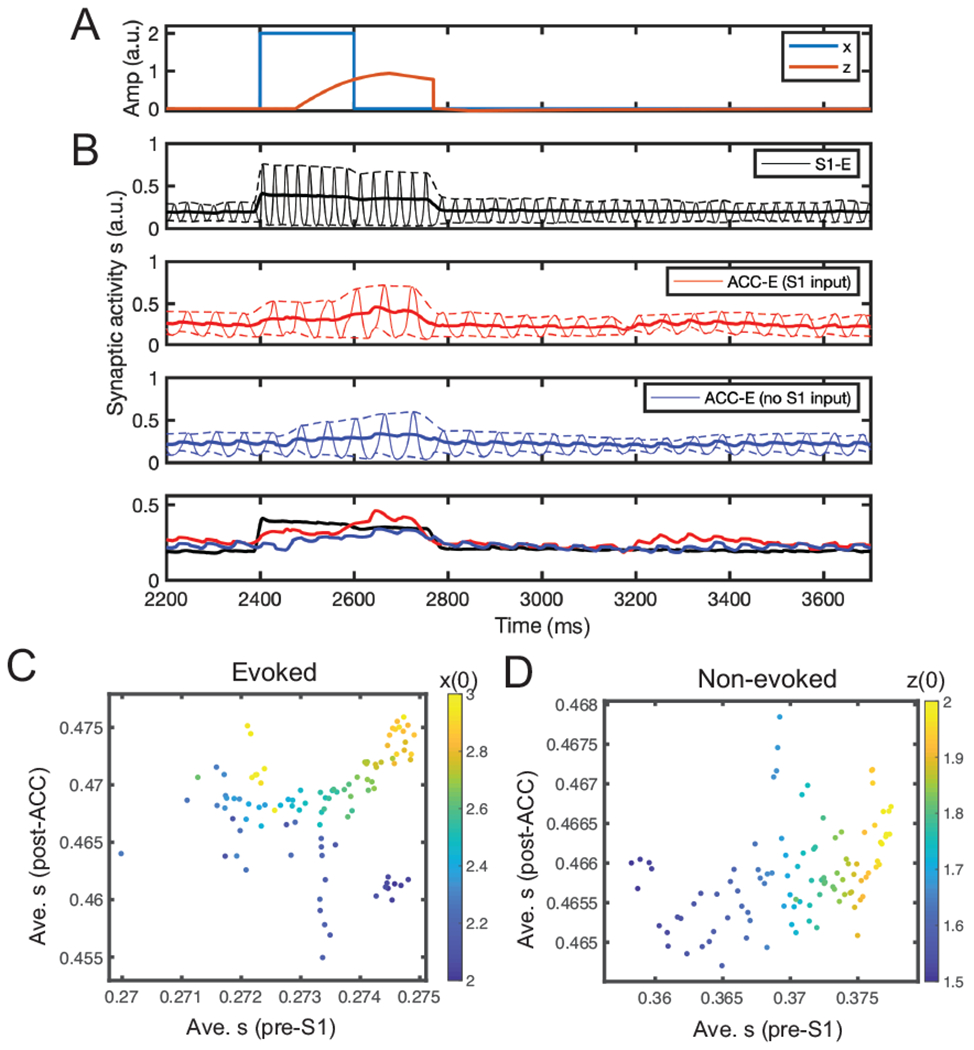
Fig. 6:

Simulation results from the mean field model. (A) Simulated stimulus input x and latent z trajectories. (B) Mean-field activity (synaptic activation s) for three different excitatory neuronal populations (E1, E2-1, E2-2) in one evoke pain simulation. Dashed lines show the upper and lower bounds of the envelop around the oscillatory activity. Solid line shows the midline between the upper and lower bounds. For comparison, the last panel replots the three midlines in the first three panels. Time 2400 ms marks the onset time for post-ACC synaptic activation integration. (C,D) Scatter plots of average pre-S1 synaptic activation s versus average post-ACC synaptic activation s derived from the mean field model simulations (n = 100) in evoked pain and non-evoked nociception. The Pearson’s correlation coefficients in two panels were 0.15 (p = 0.137) and 0.40 (p = 4.5 × 10⁻⁵), respectively. Color bar represents the different initial condition for x(0) (panel C) or z(0) (panel D).
