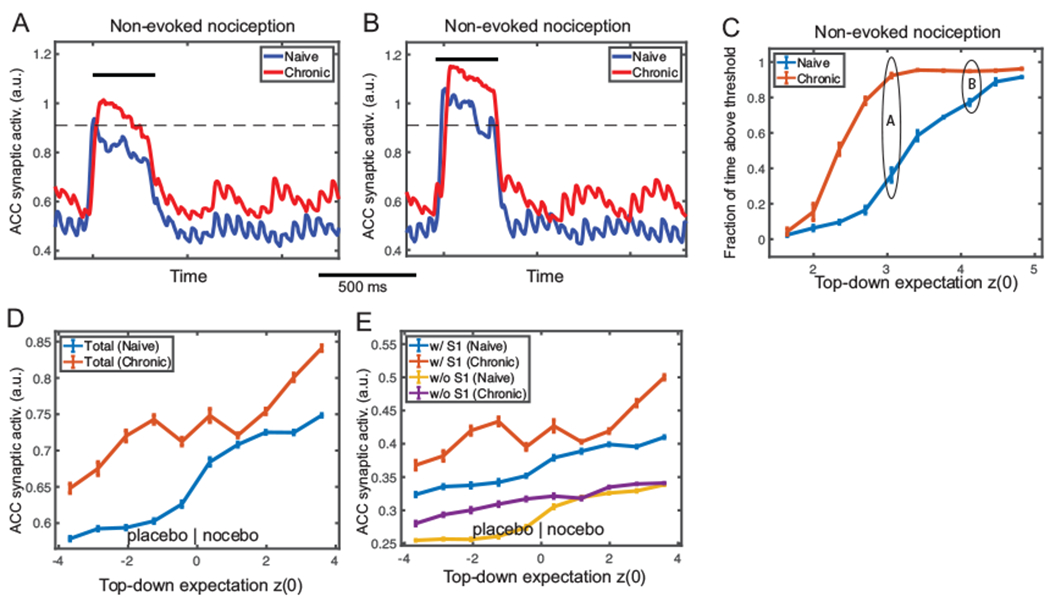
Fig. 8:

Mean field model simulation results of non-evoked nociception and placebo/nocebo effects under the chronic pain condition. (A) Simulated midline envelope trace of ACC synaptic activation variable s in non-evoked nociception under naive (blue) and chronic pain (red) conditions, for an initial top-down expectation z(0) = 3.0. (B) Similar to panel A, except for z(0) = 4.5. At low z(0), the fraction of time above threshold during Ts (between the stimulus onset and withdrawal) was longer in the chronic pain condition; at high z(0), the fraction was similar between the two conditions. (C) Fraction of time during Ts that ACC synaptic activation variable was above the threshold (horizontal dashed line) for various top-down expectation z(0) in naive (blue) and chronic pain (red) conditions. The curve has a sigmoidal shape and shifts leftward from naive to chronic pain condition. 100 Monte Carlo trials were run with random z(0) ∈ [1.5, 5.0]. Mean and SEM for each group are plotted. (D) Comparison of average ACC synaptic activation in placebo/nocebo effects under naive (blue) and chronic pain (red) conditions for various initial top-down expectation z(0), where z(0) < 0 and z(0) > 0 represent the placebo and nocebo effects, respectively. The synaptic activation s of total ACC population increased monotonically, and shifted upward from the naive to chronic pain condition. (E) Similar to panel D, except for ACC subpopulations E2-1 (w/ S1 input) and E2-2 (w/o S1 input). The subpopulation E2-1 had a similar shape of the total population, while E2-2 did not increase much from the naive to chronic pain condition. 100 Monte Carlo trials were run with random z(0) ∈ [−4.0, 4.0]. Mean and SEM are plotted for each group.
