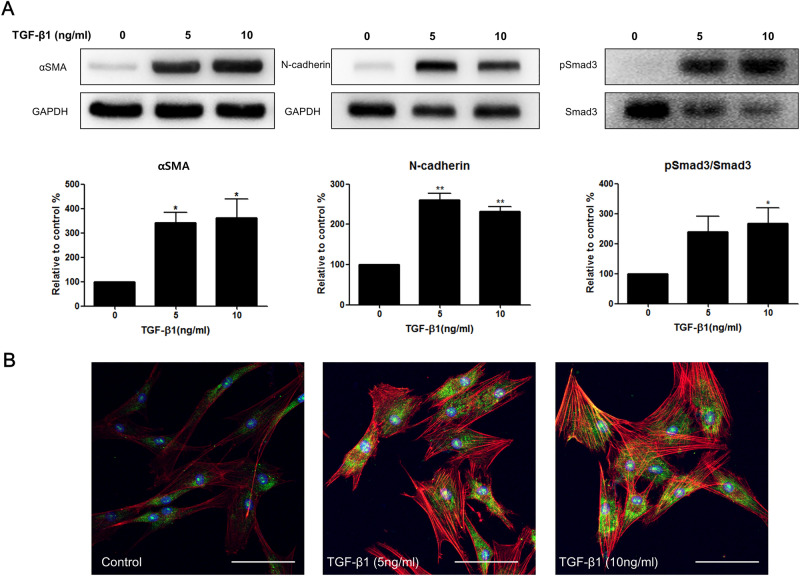
Figure 4.
Myofibroblast marker expression by TGFβ1 stimulation in keratocytes. (A) Western blot analysis after 24 h TGFβ1 stimulation. TGFβ1 increased αSMA and N-cadherin expression from keratocytes. Smad3 phosphorylation is also increased with TGFβ1 stimulation. (B) Immunocytochemical staining revealed enhanced αSMA positivity (green: αSMA, red: F-actin, blue: DAPI, white bar: 50 μm) with higher concentrations of TGFβ1 stimulation for 72 h. Note that only the bands at the adequate molecular weights were shown here. Full length gel and blots are included in the Supplementary Information. *p < 0.05, **p < 0.01.

