
Figure 3.
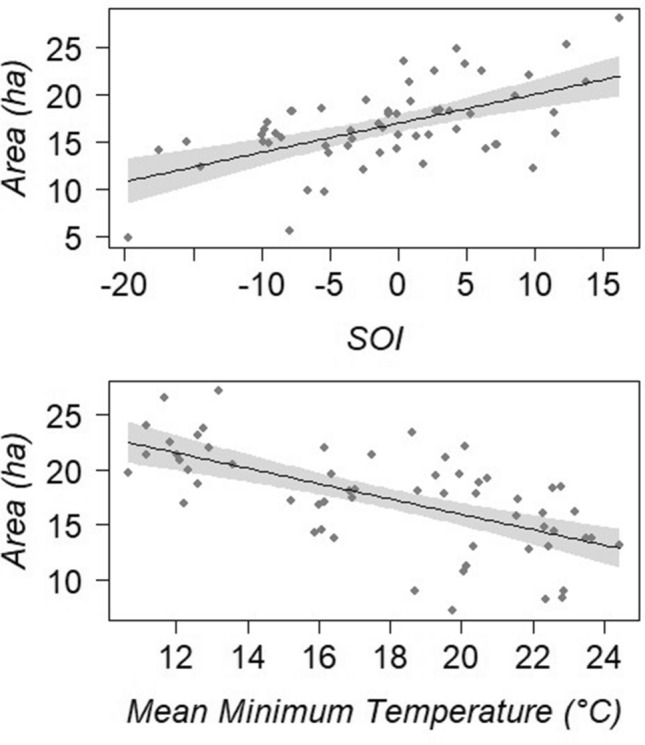
The GAMM analysis indicated the (top) SOI and (bottom) mean minimum temperature were the best predictors for area changes in mangrove canopy at Mangrove Bay (AICc = 326.69, r2(adj) = 0.508, t = 37.09, n = 58; SOI: F = 27.09, P = 0.0001; Mean Minimum Temperature: F = 36.95, P = 0.0001). Both variables displayed a linear relationship with the mangrove canopy area, with (top) SOI values indicative of El Nino and (bottom) mean minimum temperatures relating to lower green canopy.