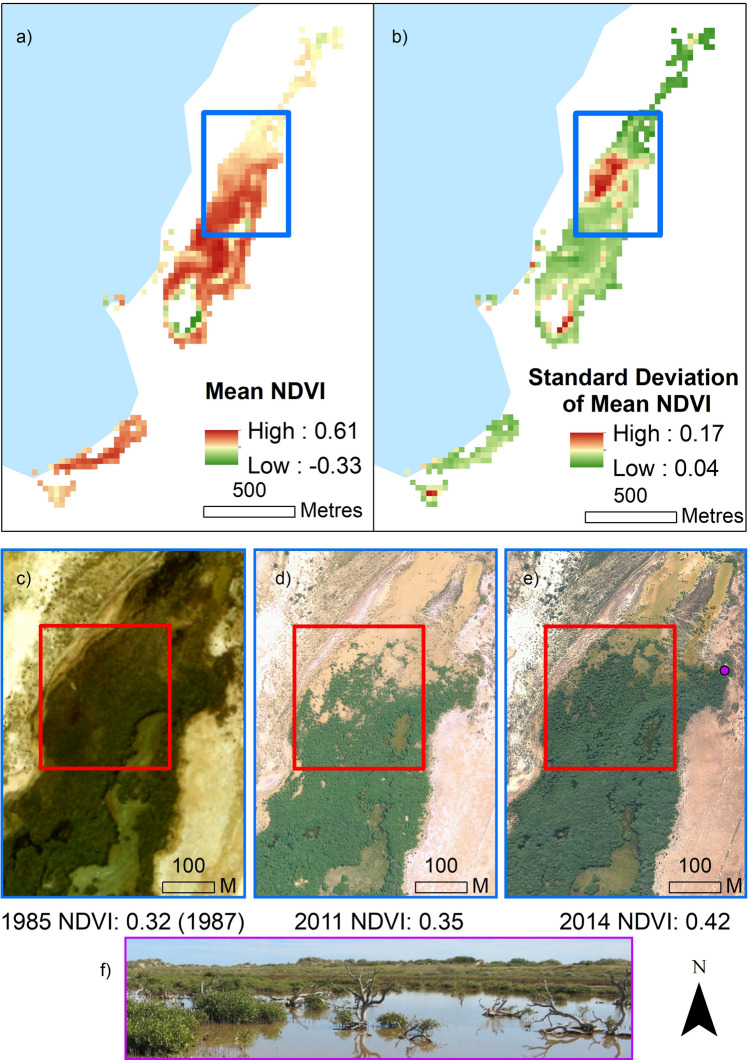
Figure 4.
(a) Mean temporal NDVI across the Mangrove Bay site is highest in the centre of the mangrove stand, proximal to the lagoon entrance, where (b) standard deviation of mean NDVI is lowest. Spatial clustering of high standard deviation of mean NDVI is apparent in the northern section, at the edge of the mangrove canopy. This area (blue outline represents area of insets c–e) in the aerial images shows examples (red box) of canopy thinning and regrowth across the study period observed at the site. NDVI values correspond to the average values of the entire mangrove region (the whole site) for that year. Dieback of trees can be seen from the photo (f) which was captured on site in June 2014 adjacent to this section of the stand (indicated by purple circle in (e). Aerial imagery provided by WA Department of Biodiversity, Conservation and Attractions. For larger version (c) see SI10.

