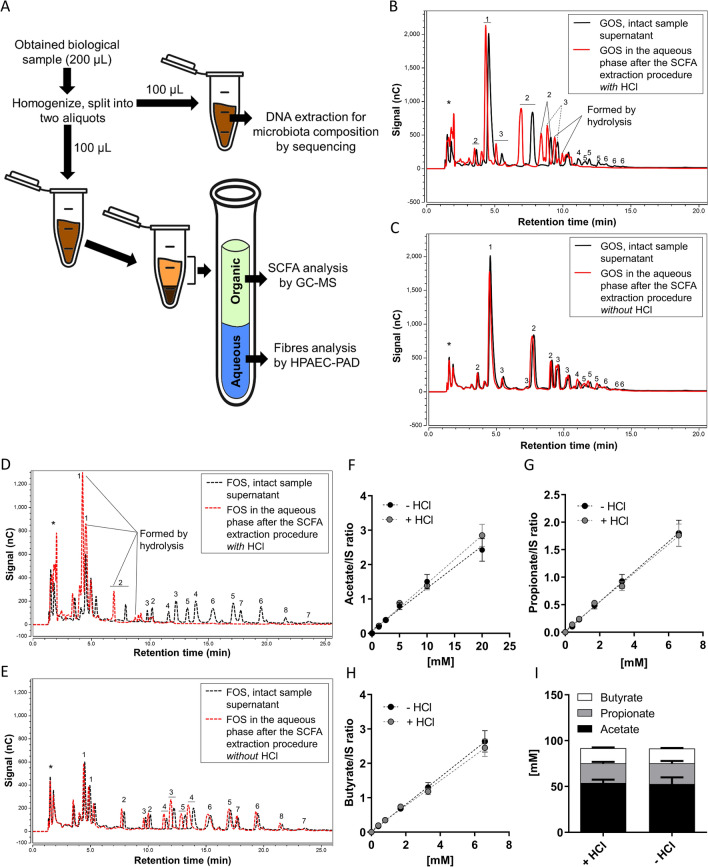
Figure 5.
Combined protocol of fibres and SCFA analysis. (A) A schematic workflow for the combined analysis of a very small gastrointestinal sample volume. HPAEC chromatograms of GOS faecal fermentation samples (B, C) and chicory FOS faecal fermentation samples (D, E). The black lines represent fibres present in the intact sample supernatant, and the red lines represent fibres present in the aqueous phase after the SCFA extraction procedure with HCl (B, D) or without HCl (C, E). The numbers in the chromatograms represent the degree of polymerization, 1 = monomers, 2 = dimers, ≥ 3 = oligomers, and * are components present in the quenching reagent and in the medium. The calibration curves of concentrations of acetate (F), propionate (G) and butyrate (H) with and without the addition of HCl in the extraction protocol, and SCFA concentrations (I) in the same faecal sample with and without the addition of HCl (mean ± SEM, n = 3–5) . GC–MS gas chromatography–mass spectrometry, HPAEC-PAD high performance anion exchange chromatography with pulsed amperometric detection.

