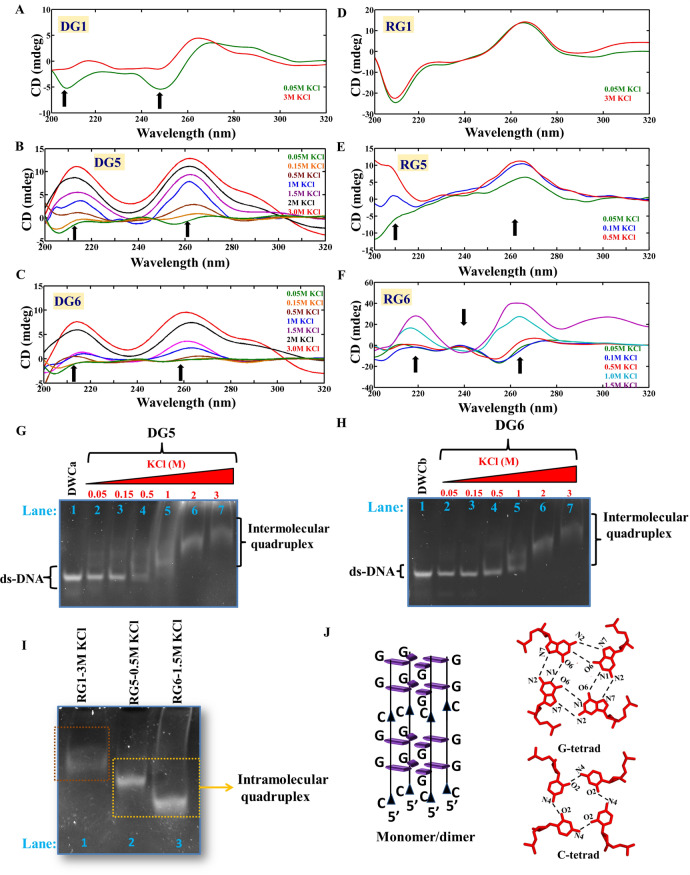
Figure 1.
Circular dichroism spectra and EMSA corresponding to DNA and RNA CGG sequences. (A–F) CD spectra and (G–I) PAGE showing the preference for the following conformations by DG1, DG5, DG6, RG1, RG5, and RG6: (A) B-form duplex (0.05 M KCl)/intermediate conformation (3 M KCl) (DG1), (B,C,G,H) intermolecular quadruplex (DG5 and DG6), (D) A-form duplex (RG1) and (E,F,I) intramolecular quadruplex (RG5 and RG6). (J) Schematic diagram illustrating the arrangement of G- and C-quadrats (taken from PDB ID: 1EVO) in a parallel RNA and DNA CGG quadruplex. This figure was generated by using pymol 1.3 (www.pymol.com). The arrows indicate the increase or decrease in the ellipticity concomitant with the change in the secondary structure (see the text for more details). The figures (A–F) were plotted by using MATLAB 7.11.0 software (www.mathworks.com). The EMSA (G–I) samples were analysed by 14% native PAGE and stained with ethidium bromide (EtBr). The unprocessed gel images (G–I) are incorporated in Supplementary Fig. S13A–C.

