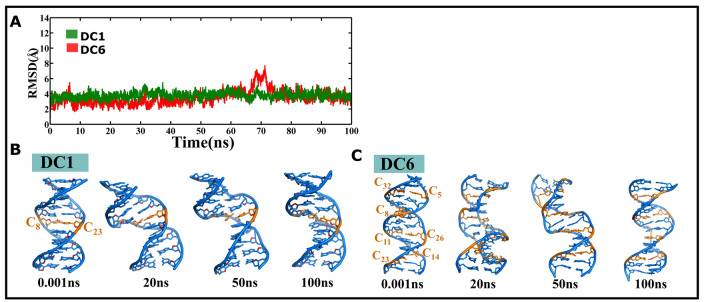
Figure 4.
CCG DNA duplexes that contain 1 and 6 C…C mismatches are quite stable. (A) Time vs. RMSD profile corresponding to DNA duplexes that have one (green color) and six (red color) C…C mismatches. The MATLAB 7.11.0 software (www.mathworks.com) was used to plot the data. Note that the lower RMSD value of 4 Å indicates the stable nature of the duplexes. Snapshots corresponding to DNA duplexes that contain (B) one and (C) six C…C mismatches. This figure was generated by using pymol 1.3 (www.pymol.com).

