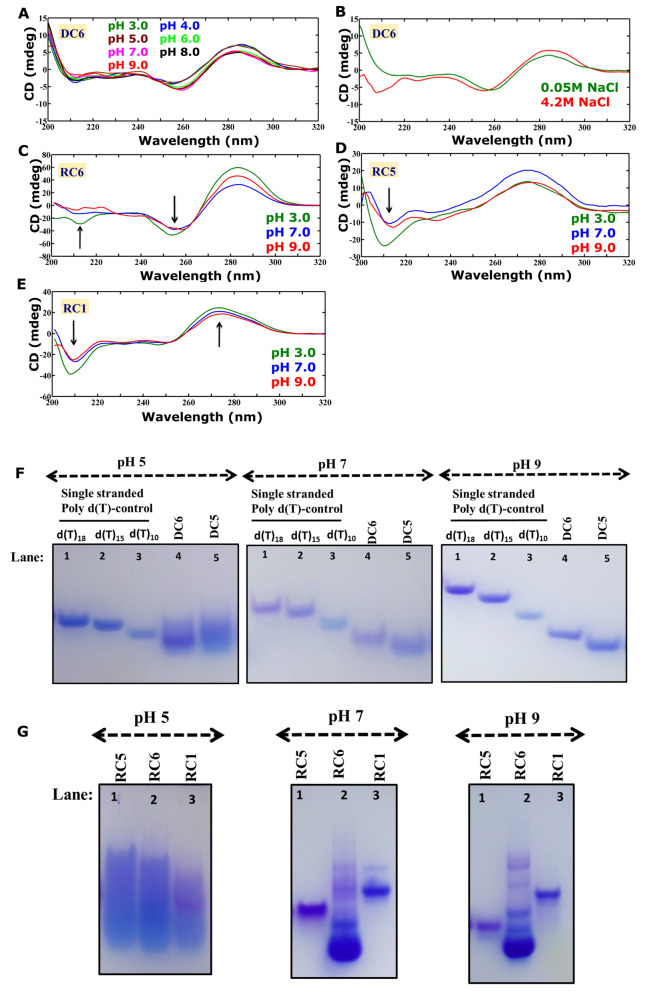
Figure 5.
Circular dichroism spectra and EMSA corresponding to the DNA and RNA duplexes comprising of CCG repeats. (A) pH and (B) salt-dependent CD spectra showing the preference for duplex conformation by DC6 that contain 6 C…C mismatches. Preference for (C,D) i-motif like conformations by RC6 and RC5, and (E) A-form conformation by RC1. The figures (A–E) were plotted by using MATLAB 7.11.0 software (www.mathworks.com). Gel picture corresponding to (F) DC6 and DC5 (lanes: 4, 5) and (G) RC5 (lane: 1), RC6 (lane: 2), and RC1 (lane: 3) sequences at pH 5 (left), pH 7 (middle), and pH 9 (right). The EMSA (F,G) samples were analyzed by 10% native PAGE and stained with Stains All dye. The unprocessed gel images (F,G) are incorporated in Supplementary Fig. S13D,E.

