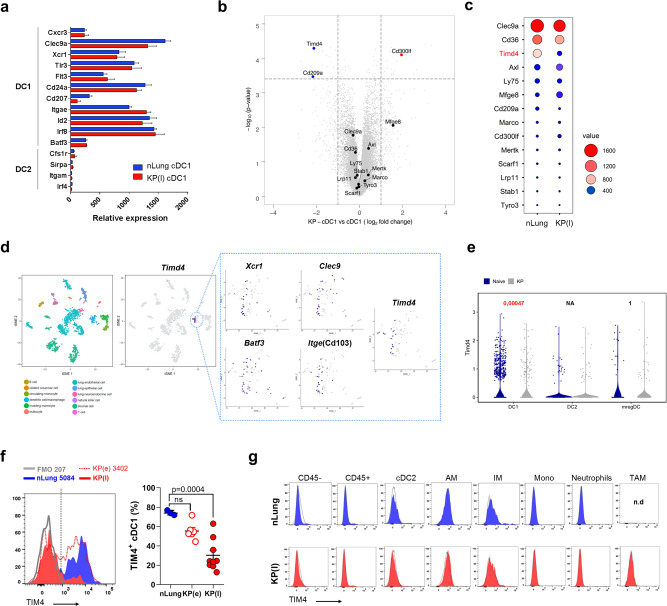
Fig. 3. Selective cDC1 expression of the PtdSer receptor TIM4 in lung phagocytes and downregulation in tumors.
a cDC1 were isolated from nLung or late KP tumors to analyze transcriptional profiles. The graph shows expression of cDC1 and cDC2 lineage specific genes in nLung-sorted and tumor-sorted cDC1. Data are expressed as mean ± SD with nLung n = 4, KP(l) n = 3. b Volcano plot showing the fold change of genes encoding scavenger receptors (significantly modulated genes are depicted in red and blue, using a q-value < 5%, a false discovery rate (FDR) ≤ 5% and a fold change ≥2 or ≤2), using the Significance Analysis of Microarray (SAM) algorithm. c The dot-plot shows the relative abundance of genes in b using a color and size scale of linear expression values. d T-distributed stochastic neighbor embedding (tSNE) plots of single cells expression profiles in mouse lungs (Tabula Muris). Colors represent clusters of different subsets based on global similarity of gene expression. The cluster corresponding to DC-macrophages was further analyzed to assess co-expression of cDC1 markers and Timd4 transcripts, as depicted in the boxes. e scRNA seq of naive and KP lung tumors from16 were analyzed to visualize Timd4-expressing cells in three subpopulation of lung DCs. Violin plots show expression of Timd4 in cDC1, cDC2, and mregDCs. Statistical analysis was performed using Seurat R package, taking in consideration both number of expressing cells and levels of expression. f Representative histograms and quantification of the percentage of cells expressing TIM4 in nLung, early and late lung tumors (the gate for identification of positive and negative cells is depicted in the histogram). Data are from nLung n = 3, KP(e) n = 6, KP(l) n = 9 mice. Significance was determined by one-way ANOVA followed by Tukey’s post-test; data are expressed as mean ± SEM. g Representative histograms of TIM4 expression on total CD45− and CD45+ cells and all lung phagocytic subsets in nLung and late KP lungs. Alveolar macrophages (AM), interstitial macrophages (IM), tumor associated macrophages (TAM), monocytes (Mono). Each peak is overlaid on the corresponding FMO controls (black line). Source data are provided as a Source Data file.

