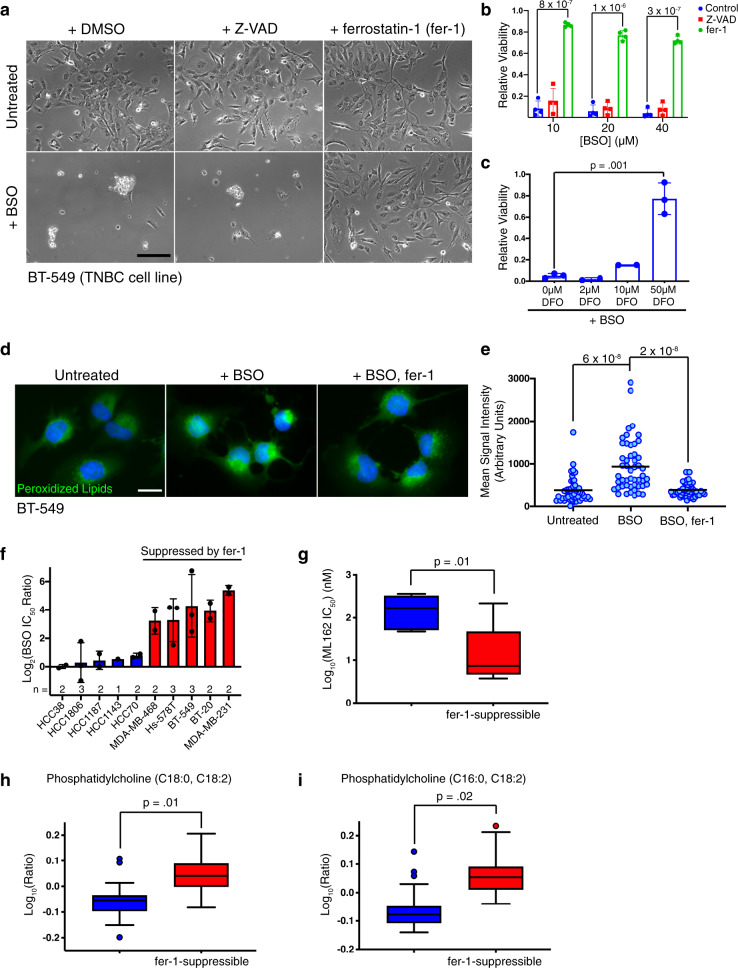
Fig. 1. Glutathione depletion triggers ferroptosis in a subset of TNBC cell lines and elevated polyunsaturated fatty acid levels are associated with vulnerability to ferroptosis.
a Light micrographs of BT-549 cells treated with 10 μM BSO for 72 h in the presence or absence of 20 μM Z-VAD-FMK or fer-1. Scale bar represents 200 μm. b BT-549 relative cell viability after 72 h of BSO treatment with vehicle, 20 μM Z-VAD-FMK, or 2 μM fer-1 (n = 4 independent experiments). Error bars, here and below, denote standard deviation centered on the mean. The numbers above the brackets are p values from Student’s t-tests (two-sided) unless otherwise noted. p values were not corrected for multiple testing unless stated. c Relative viability of BT-549 cells treated with 10 μM BSO and the indicated concentration of deferoxamine (DFO) for 72 h (n = 3). Values were normalized to account for loss of viability associated with DFO. d Representative fluorescent micrographs of BT-549 cells treated with vehicle, BSO (50 μM), or BSO and fer-1 (2 μM) for 48 h. Green corresponds to cellular macromolecules modified with peroxidized lipid breakdown products (Click-iT lipid peroxidation detection kit, ThermoFisher Scientific). DNA is stained blue. Scale bar represents 20 μm. e Quantitation of lipid peroxidation products from individual cells (n = 50 per condition) in d. Lines represent the mean. f The log2-transformed ratio of the IC50 of BSO in the presence or absence of 2 μM fer-1 for each cell line. Cell lines in which fer-1 reduced cell death from BSO > 8-fold are designated “fer-1-suppressible”. g Box and whiskers plot of the log2-transformed IC50 values for ML162 in non-fer-1-suppressible (blue) and fer-1-suppressible (red) TNBC cell lines (as defined in f). The line represents the median value, the box defines the interquartile range (25th to 75th percentile), and the whiskers show minimum and maximum values. h Box plots showing the log10-transformed, median-normalized relative levels of phosphatidylcholine (C18:0, C18:2) and i phosphatidylcholine (C16:0, C18:2) in non-fer-1-suppressible and fer-1-suppressible TNBC cell lines. Each cell line is represented by at least 5 replicates. p values based on ANOVA and corrected for multiple testing. The line shows the median value, the box shows the interquartile range, the whiskers represent the upper and lower adjacent values, and outliers are shown as dots. Source data are provided as a Source Data file.

