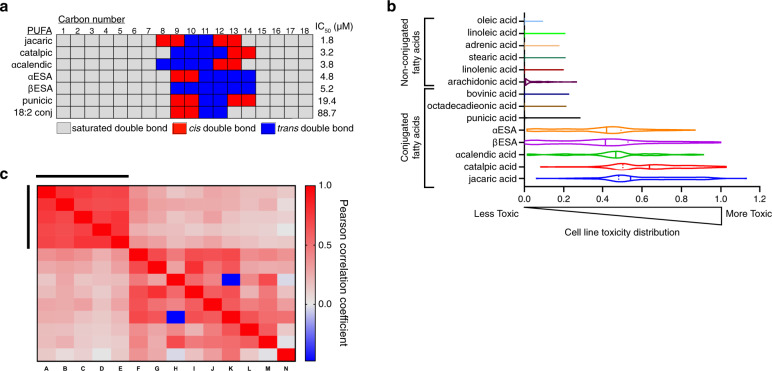
Fig. 3. Conjugated linolenic fatty acids are generally toxic to diverse cancer cells.
a Schematic representing the location and double bond geometry of 18-carbon conjugated polyunsaturated fatty acids. Cell viability IC50 values are shown for each conjugated PUFA from at least two biological replicate measurements in MDA-MB-231 cells after 72 h of treatment. b Assessment of fatty acid toxicity across cancer cell lines. A mixture of 100 barcoded human cancer cell lines were treated in triplicate with the indicated fatty acid at doses from 0–35 µM. Viable cells of each cell line in the mixture were quantified at 48 h of treatment. A violin plot illustrates the distribution of cell line-specific toxicities (calculated as the area over the dose dependent-cell viability curve across the treatment dose range). A toxicity value of 1 denotes complete loss of viable cells and 0 corresponds to viability similar to vehicle-treated controls. Dark bars denote median toxicity against all cell lines in the panel and dotted lines indicate quartile boundaries. c Heatmap presenting the Pearson correlation coefficients of the activity areas across the cancer cell line panel in b for each pair of fatty acids in the test set of fourteen. Red shows positive correlation and blue indicates negative correlation. The bars denote the position of the following conjugated linolenic acids from left to right and top to bottom: jacaric acid, catalpic acid, α-calendic acid, βESA, and αESA. Source data are provided as a Source Data file.

