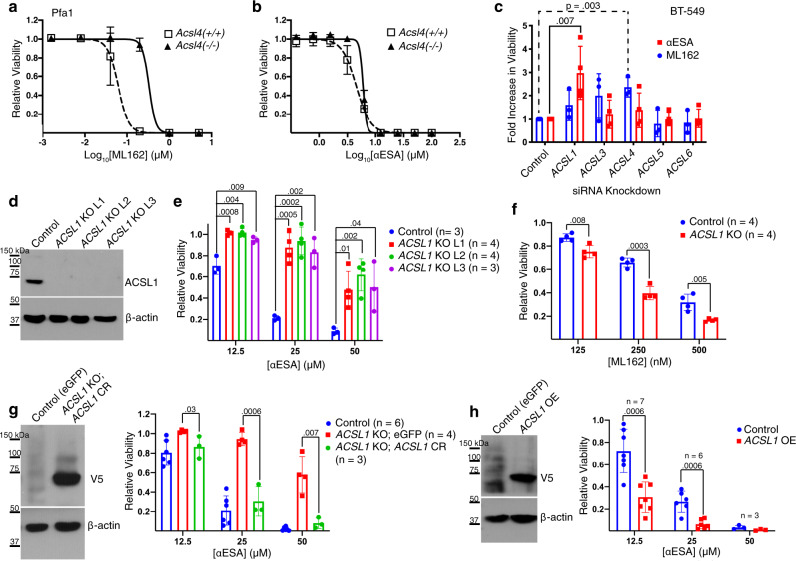
Fig. 5. ACSL1 mediates ferroptosis triggered by αESA.
Cell viability dose-response curves for control and ACSL4-deficient Pfa cells treated with a, ML162 or b, αESA. Error bars indicate standard deviation from three independent experiments centered on the mean. c Bar charts showing fold change in the fraction of viable BT-549 relative to cells transfected with a non-targeting siRNA, 72 h after transfection with the designated ACSLI-targeted siRNA followed by 24-h treatment with either ML162 (blue, n = 3 independent experiments) or αESA (red, n = 4 independent experiments). Error bars in this and subsequent panels show standard deviation centered on the mean. p values < 0.05 from Student’s t-test (one-sided) are indicated. d Western showing ACSL1 protein levels in control BT-549 cells expressing a non-targeting guide RNA and three single-cell BT-549 clones in which ACSL1 was disrupted using CRISPR/Cas9 technology (ACSL1 KO L1–3). Similar results were observed using an independent ACSL1-targeting guide RNA (Supplementary Fig. 4g). e Relative cell viability of control and ACSL1 KO lines after 48 h of treatment with the specified dose of αESA or f, ML162 (n = 4 independent experiments). p-values are shown above comparator bars in this and subsequent panels (two-sided Student’s t-test). g V5 western blot (left) showing transgenic re-expression of V5-tagged, CRISPR-resistant ACSL1 (ACSL1 CR) and (right) relative viability of control (eGFP), ACSL1 KO (eGFP), or ACSL1 KO cells expressing ACSL1 CR after 48 h of treatment with the indicated dose of αESA. h Western blot (left) of V5-tagged ACSL1 in BT-549 cells stably over-expressing the protein compared to a control line expressing eGFP, and (right) the fraction of viable cells remaining for each cell line after 48 h of treatment with the noted dose of αESA. Source data are provided as a Source Data file.

