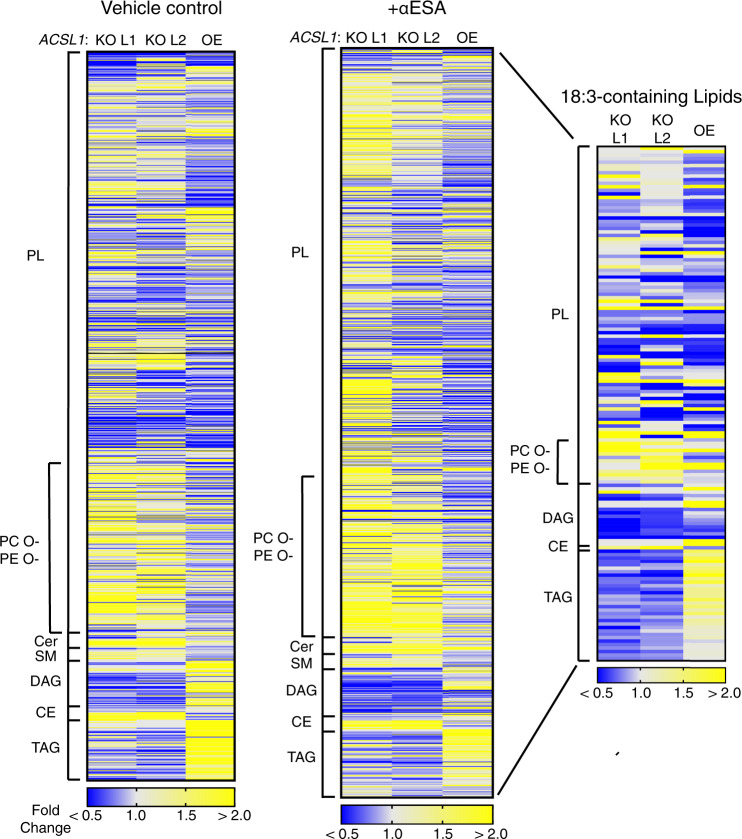
Fig. 6. ACSL1 drives incorporation of αESA into neutral lipids.
Heatmaps representing relative lipid abundance in ACSL1-deficient (ACSL1 KO L1, L2) or overexpressing (ACSL1 OE) BT-549 cells as fold-change in mole percent compared to control cells after 16 h treatment with 50 μM αESA (right and middle) or in untreated cells (left). The rightmost heatmap shows only the subset of lipids with 18:3 acyl chains. Yellow indicates an increase in relative abundance and blue shows a decrease in relative abundance. PL = phospholipids, CE = cholesterol esters, Cer = ceramide, DAG = diacylglycerol, PC O- = ether-linked phosphatidylcholine, PE O- = ether-linked phosphatidylethanolamine, SM = sphingomyelin, TAG = triacylglycerol. Source data are provided as a Source Data file.

