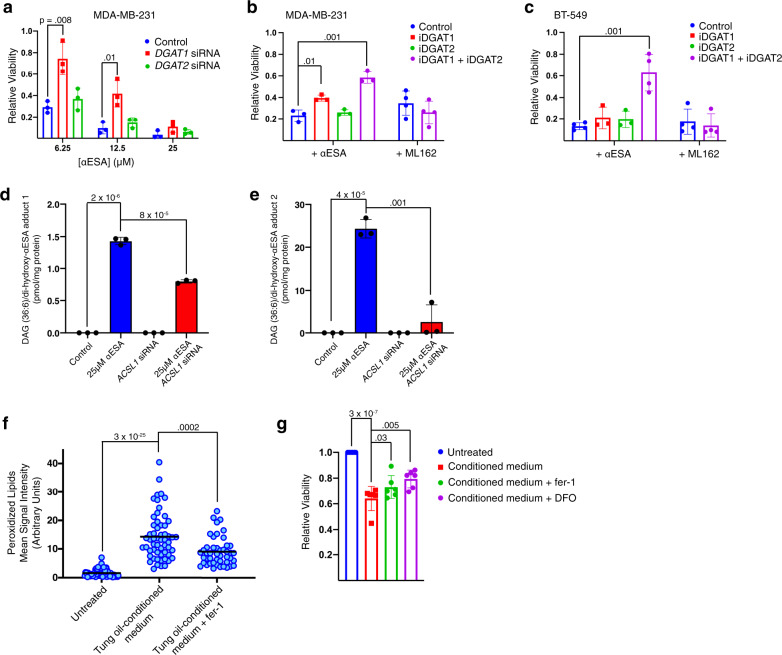
Fig. 8. Incorporation of αESA into triacylglycerols promotes ferroptosis.
a Relative viability of MDA-MB-231 cells 72 h after transfection with either DGAT1-targeting, DGAT2-targeting, or non-targeting siRNA followed by 24-hour treatment with indicated dose of αESA (n = 3 independent experiments). Error bars in this and subsequent panels show standard deviation centered on the mean, and p-values above comparator bars in this and subsequent panels are from two-sided Student’s t-tests unless noted. Bar charts showing the fraction of viable (b), MDA-MB-231 or (c), BT-549 cells incubated for 48 h with either 6.25 μM αESA (n = 3 and 4 for MDA-MB-231 and BT-549, respectively) or 62.5 nM ML162 (n = 4) and either vehicle, a DGAT1 inhibitor (4 μM PF-04620110), a DGAT2 inhibitor (4 μM PF-06424439), or both inhibitors. d, e Bar charts showing the amount of two DAG (18:3/18:3)/dihydroxy αESA adducts that were detected following treatment with αESA and were significantly decreased by ACSL1 depletion (n = 3 biological replicates). The m/z of adduct 1 and adduct 2 are 940.7278 and 942.7439, respectively. f Quantitation of lipid peroxidation products in individual BT-549 cells after being cultured for 2 h with normal medium, tung oil-conditioned medium, or tung oil-conditioned medium containing 2 μM fer-1. The line indicates the mean. From left to right, n = 71, 57, and 46. g Bar charts showing relative cell viability for BT-549 cells cultured in normal growth medium or tung oil-conditioned medium with or without 2 μM fer-1 or 50 μM DFO (n = 6 independent experiments). The values above the comparator bars represent the p-values from one-sided Student’s t-tests. Source data are provided as a Source Data file.

