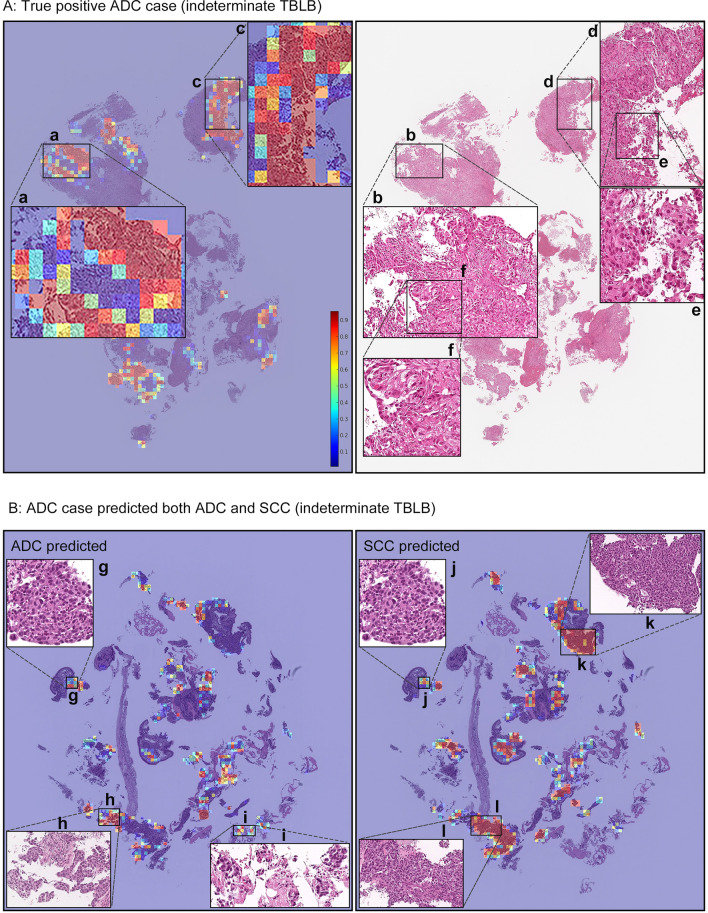
Figure 3.
(A) shows a true positive ADC case (ADC-046) from the indeterminate TBLB test set. Heatmap images (a) and (c) show true positive predictions of ADC cells, and they correspond respectively to (b) and (d). The high magnification (e) and (f) subimages show spindle shaped and poorly differentiated morphology. Pathologists found it challenging to distinguish between ADC and SCC based on H&E histology alone. (B) shows a case (ADC-009) that was predicted as indeterminate, with the model showing strong predictions for both ADC and SCC. The (g) and (j) areas are almost overlapped, and based on the histology it is poorly differentiated and is impossible to decide between ADC and SCC. (k) and (l), and (h) and (i) have similar morphologies to poorly differentiated SCC and ADC, respectively, and the model strongly predicted them as such, respectively. In the heatmap colour spectrum, red indicates high probability, blue indicates low.

