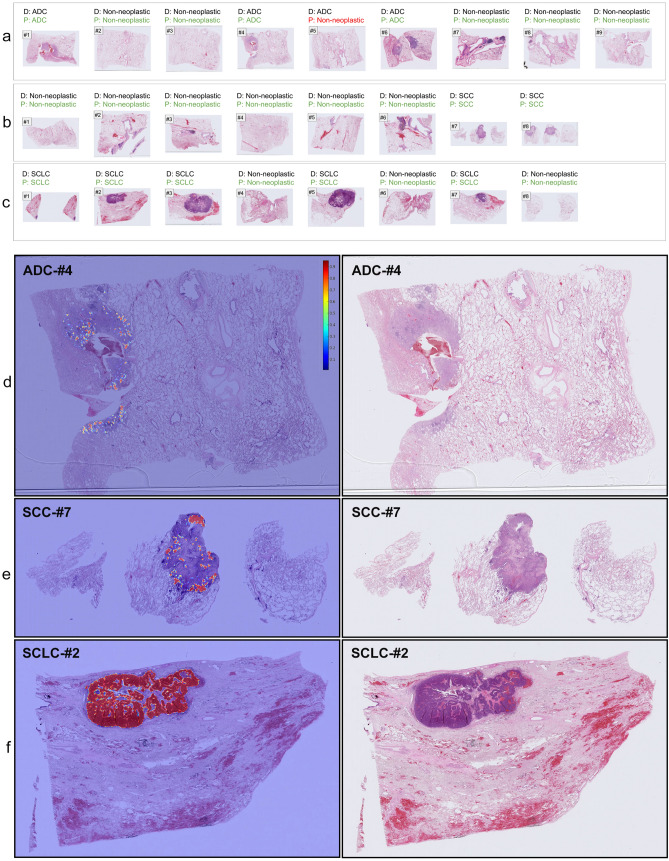
Figure 5.
(a–c) show representative surgical serial sections for ADC (#1-#9), SCC (#1-#8), and SCLC (#1-#8), respectively, and their associated diagnosis (D) and prediction (P) by our model. (a) #5 is a false negative prediction while all the rest are true positives. (d–f) show representative true positive probability heatmaps for ADC (d), SCC (e), and SCLC (f), respectively. Histopathologically, all the detected areas correspond to cancer cells. In the heatmap colour spectrum, red indicates high probability, blue indicates low.

