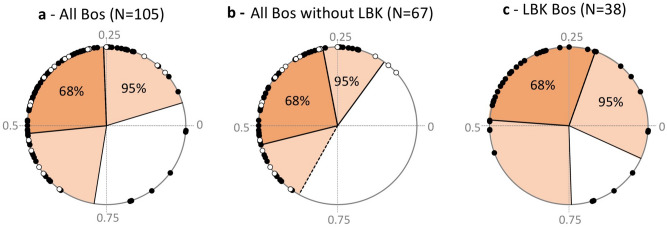
Figure 3.
Distribution of cattle births throughout the annual cycle, from the sequence of δ18O values measured in the third molar (M3). (a) All European sites; (b) European sites without Linearbandkeramik sites; (c) Linearbandkeramik sites only. The a- and b- datasets include lower (•) and upper third molars (o). Data from the upper M3 were corrected for the purposes of comparison with the lower M3. Only lower molars are included in the statistics. The dark shaded area represents the main birth period (when 68% of births occur); births outside the 95% interval are out-of-season births.

