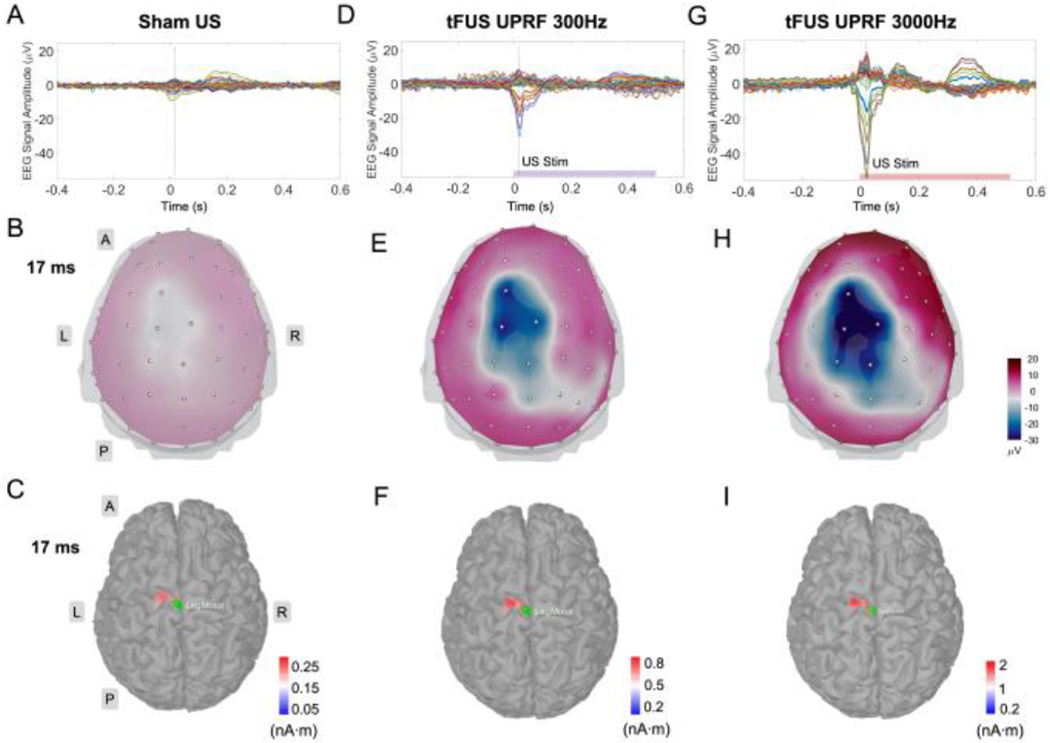
Fig. 3.

The MRCP source analyses of the 64-channel scalp EEG acquired from Sham US (A), UPRF 300 Hz (D) and UPRF 3000 Hz (G) sessions. The vertical dashed lines in the EEG butterfly plots indicate the time point, i.e. 17 ms. The 3D EEG voltage topography maps (top view) show a whole-brain comparison between the three ultrasound conditions using the same color scale (B, E and H). The panels of (C), (F) and (I) show more detailed views of the brain activities specifically at the primary motor cortex (M1) in responses to the three ultrasound sessions, respectively. The ESI illustrated reconstructed current source densities thresholding at the 75% of local maximums. The green patches in these ESI panels represent the seed areas for further extracting the MRCP source profiles. Different color scale bars are used to allow better presentation of the localized motor source at the cortical brain. L: left, R: right, A: anterior, P: posterior.
