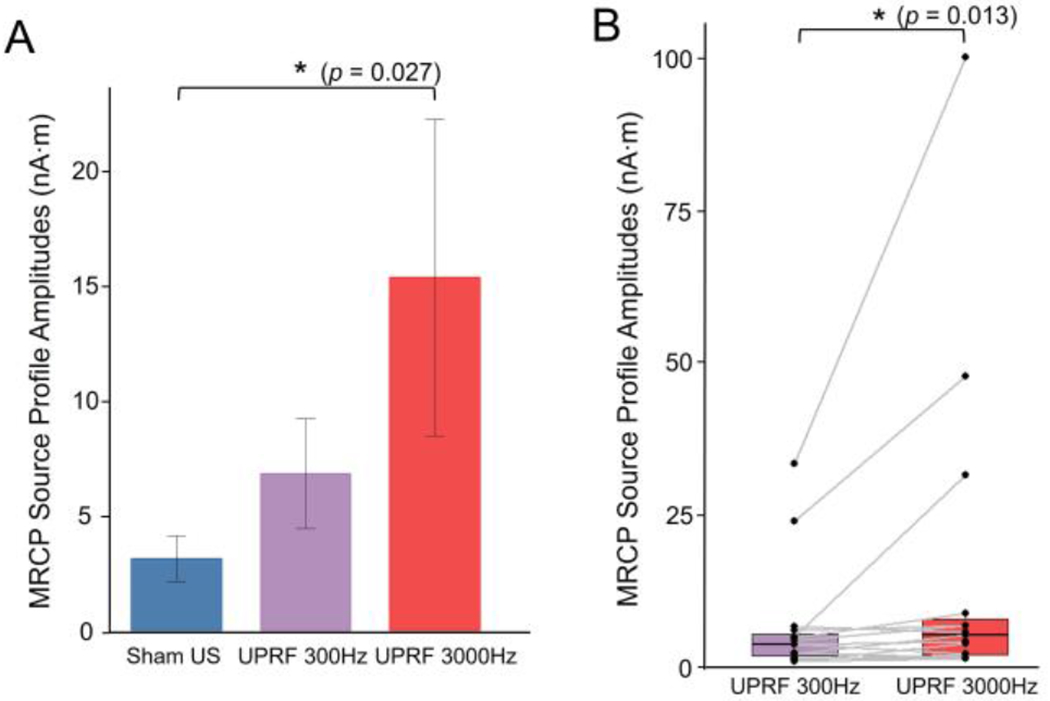
Fig. 5.

Examining the neural effects of tFUS UPRF. (A) Data are shown as the mean ± s.e.m., statistics by Kruskal-Wallis rank sum test. *p < 0.05. (B) Data are shown in the boxplots as the median with 25% and 75% quantiles (lower and upper hinges). Statistics by one-tail non-parametric paired Wilcoxon rank sum test for examining the effect UPRF increase. *p < 0.05.
