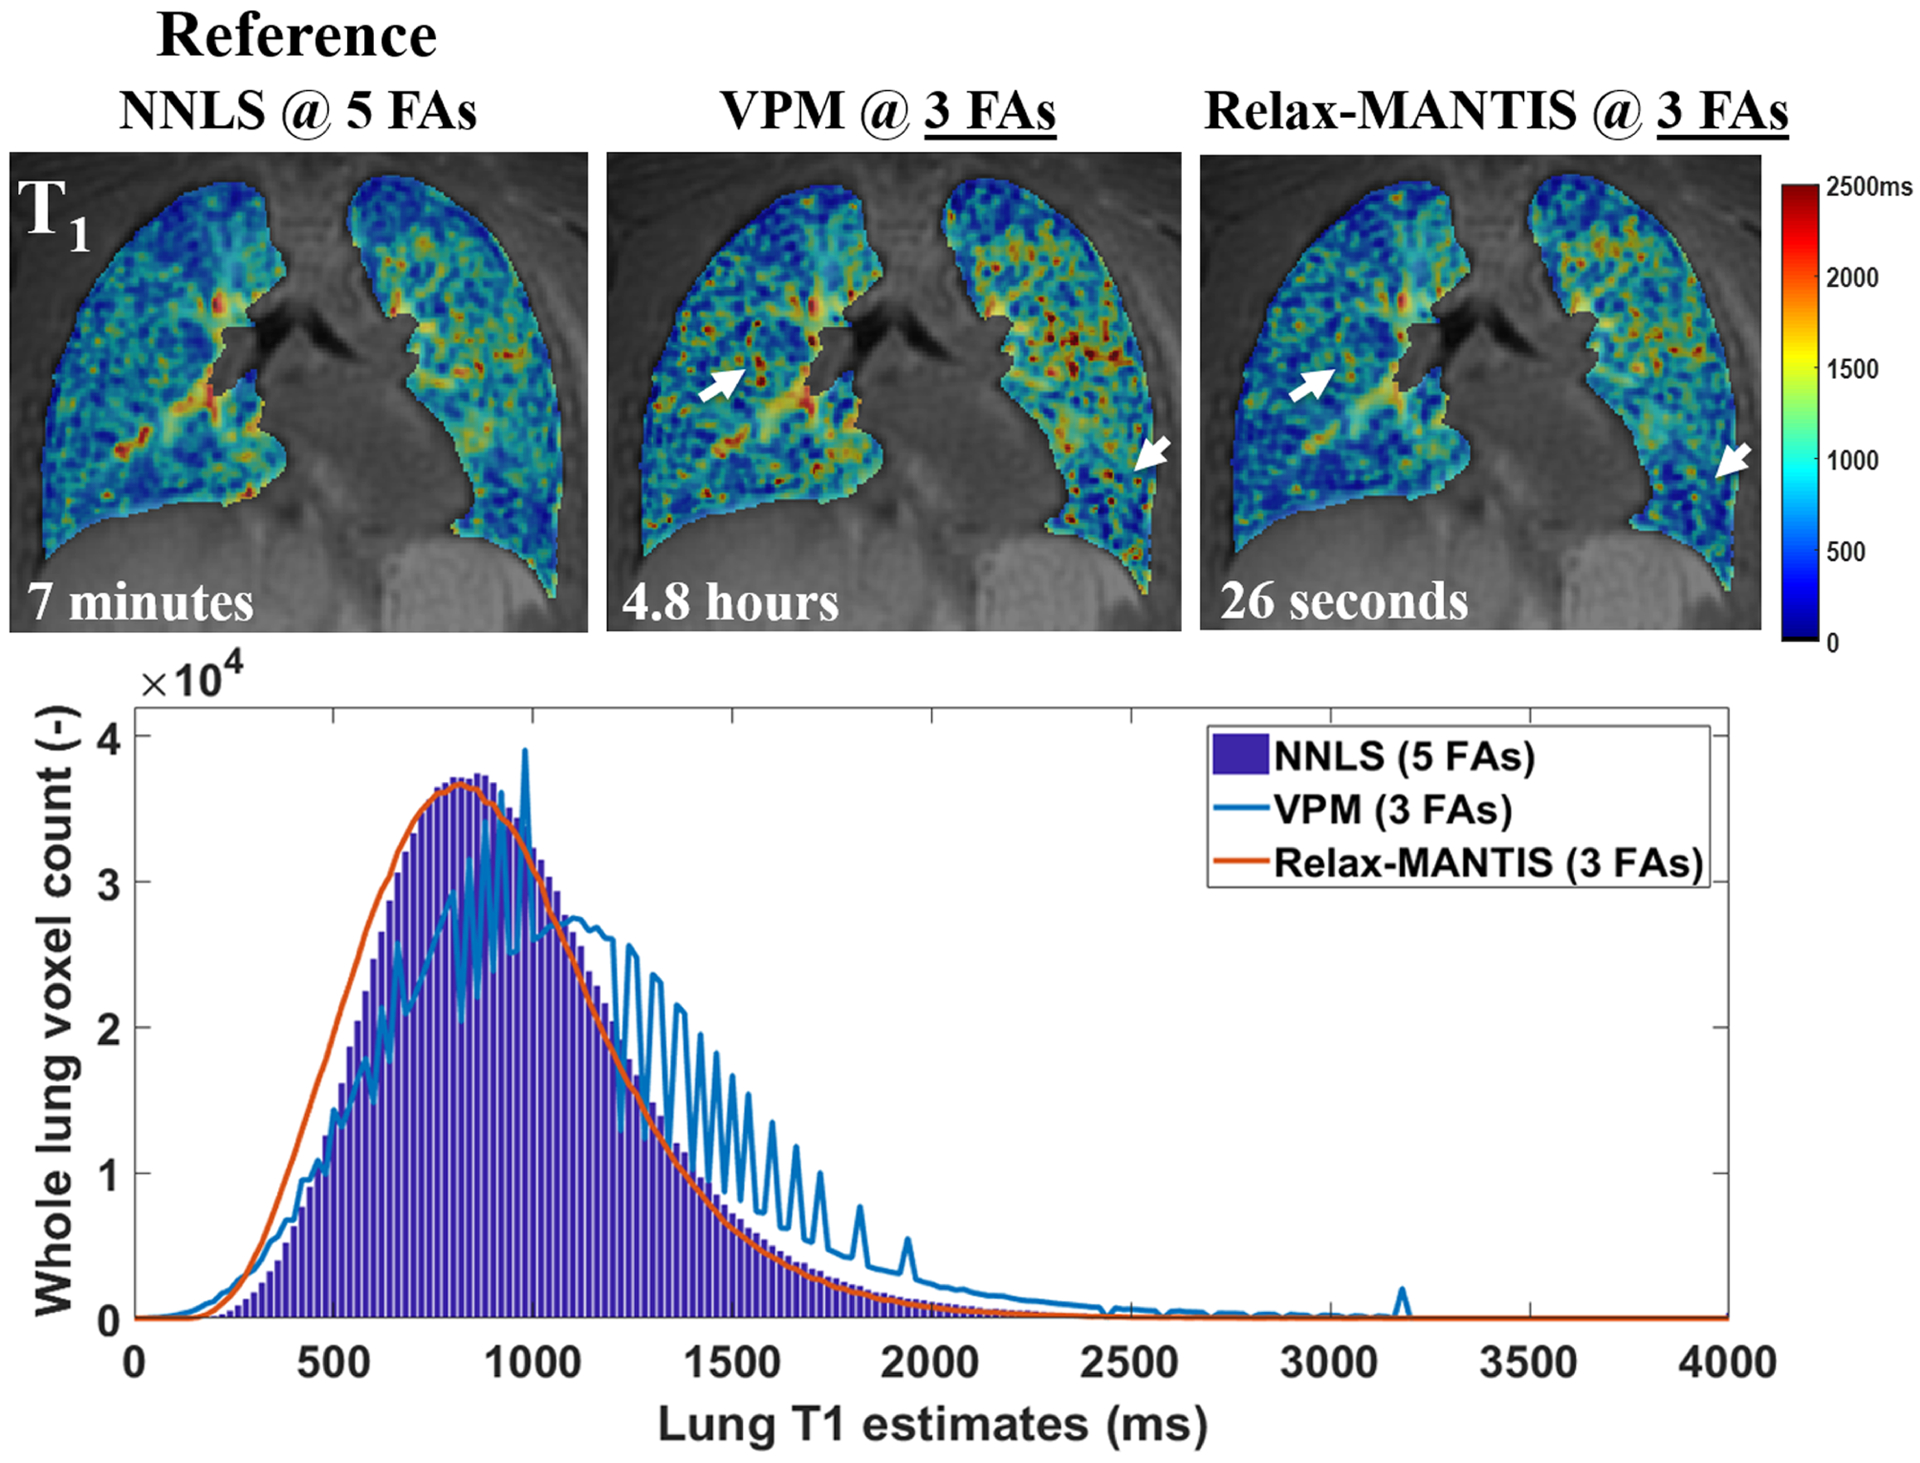
FIGURE 10.

Examples of the estimated T1 from UTE VFA lung data (SNR = 8.7) derived using standard non-linear least-squares fitting (NNLS)215 with five FAs, the widely used maximum likelihood variable projection method (VPM)216 with three FAs, and a self-supervised reference-free deep learning method (Relax-MANTIS) with three FAs. The T1 values obtained with Relax-MANTIS showed similar regional variations as seen with NNLS with five FAs and less noisy measurements (white arrows) seen from VPM with three FAs. The lung T1 histogram comparison suggests that whole lung T1 distribution estimated using the deep learning method Relax-MANTIS with three FAs (orange curve) conforms much better to the distribution from the NNLS with five FAs (bar graph in blue). Relax-MANTIS provides good quantitative agreement with five-FA standard NNLS while using only three FAs, indicating a 40% scan time reduction for an accurate whole lung parenchymal T1 quantification. The computing time for each 3D lung volume is significantly lower for the deep learning method at 26 s in comparison with the conventional methods at several minutes to hours. (Image courtesy of Wei Zha, PhD)
