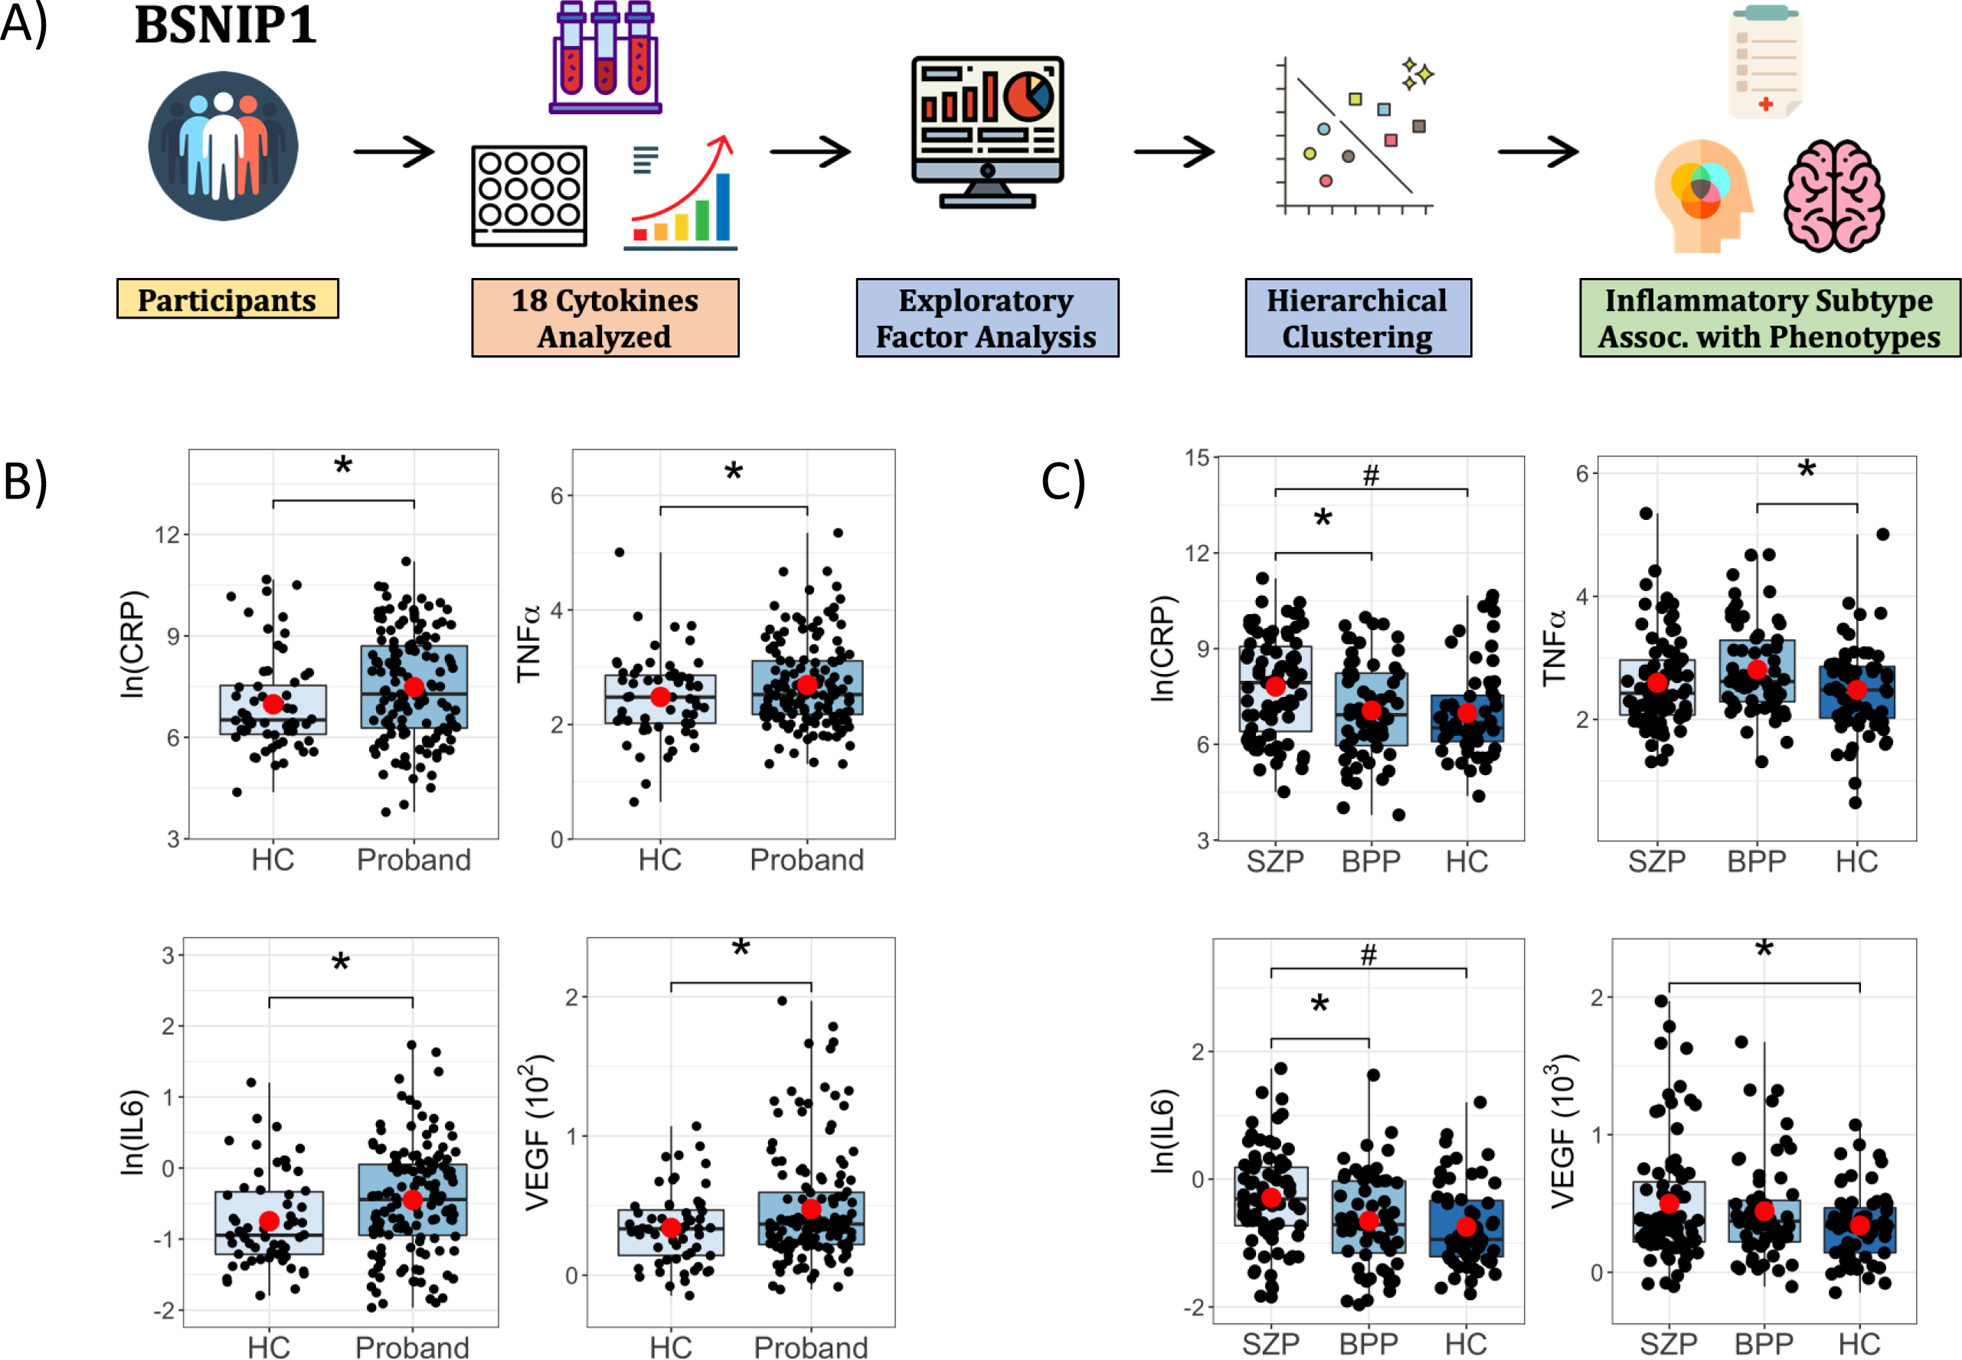
Figure 1: Study Design and Group Comparisons.

A) Participants from the B-SNIP1 study underwent cytokine level measurements and 18 cytokines were selected for group comparisons. This was followed by unsupervised exploratory factor analysis and unsupervised hierarchical clustering to identify inflammatory subtypes that were associated with psychosis phenotypes. B) Boxplots showing pairwise contrasts of CRP, IL6, TNFa and VEGF between probands and healthy control (HC) subjects and C) between schizophrenia (SZP), psychotic bipolar group (BPP) and HC subjects. ln = natural log; *p<0.05, #q<0.05, (•) mean.
