
Figure 2: Exploratory Factor Analysis and Group Comparisons.
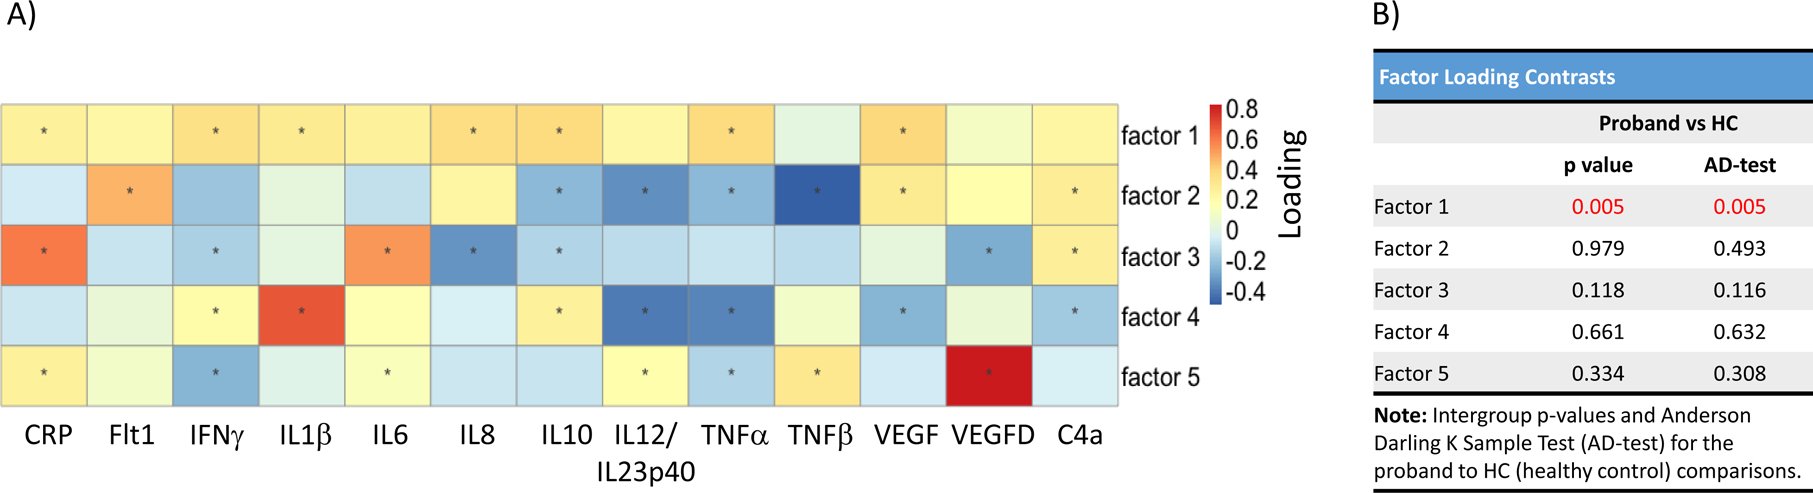
A) 13 cytokines with <10% of missing data were used in the exploratory factor analysis across the whole sample. Five factors made up 70% of the explained variance. Factors with lower explained variance have smaller magnitude loadings. This is illustrated in the heatmap. For example, factor 1 is made up of CRP, IFNg, IL1b, IL8, IL10, TNFa, and VEGF. B) Factor loadings for each individual were used for group comparisons and the intergroup p-values and the Anderson-Darling k-sample test (AD-test) are listed in the table. *, p<0.05; Red indicates significant values.