
Figure 3: Hierarchical clustering defines two cytokine-based groups (Inflammatory Subtypes).
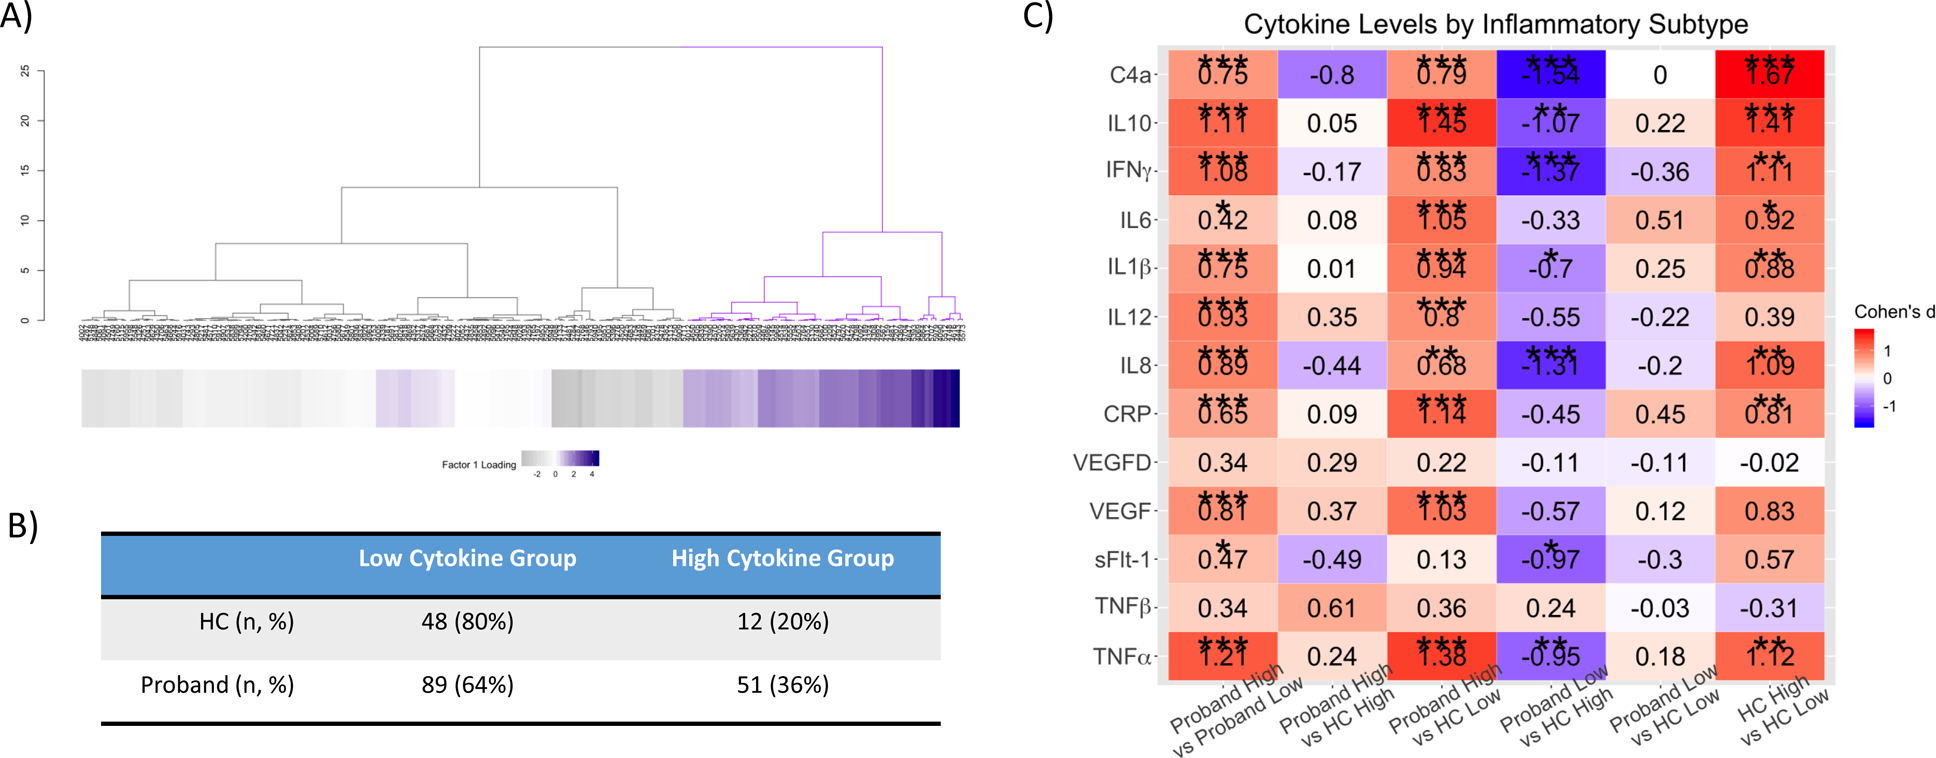
A) Hierarchical clustering analysis with the height of each linkage in the dendrogram representing the distance between the clusters joined by that link. The heatmap consists of factor loadings with gray indicating lower scores and purple indicating higher scores. B) Table showing that one subgroup contains elevated cytokine levels while the other subgroup has lower cytokine levels. The high cytokine subgroups comprise 36% of the psychosis group and 20% of the control group. C) Pairwise contrasts of cytokine levels between Proband High, Proband Low, healthy control (HC) High and HC Low subjects. Cohen’s d estimates were adjusted for age, sex, and ancestry. *, p < 0.05; **, p <0.01; ***, p < 0.001.